Experian 2009 Annual Report Download - page 16
Download and view the complete annual report
Please find page 16 of the 2009 Experian annual report below. You can navigate through the pages in the report by either clicking on the pages listed below, or by using the keyword search tool below to find specific information within the annual report.-
 1
1 -
2
-
3
-
4
-
5
-
 6
6 -
 7
7 -
 8
8 -
 9
9 -
 10
10 -
 11
11 -
 12
12 -
 13
13 -
 14
14 -
 15
15 -
 16
16 -
 17
17 -
 18
18 -
 19
19 -
 20
20 -
 21
21 -
 22
22 -
 23
23 -
 24
24 -
 25
25 -
 26
26 -
27
-
28
-
29
-
30
-
31
-
32
-
33
-
34
-
35
-
36
-
37
-
38
-
39
-
40
-
41
-
42
-
43
-
44
-
45
-
46
-
47
-
48
-
49
-
50
-
51
-
52
-
53
-
54
-
55
-
56
-
57
-
58
-
59
-
60
-
61
-
62
-
63
-
64
-
65
-
66
-
67
-
68
-
69
-
70
-
71
-
72
-
73
-
74
-
75
-
76
-
77
-
78
-
79
-
80
-
81
-
82
-
83
-
84
-
85
-
86
-
87
-
88
-
89
-
90
-
91
-
92
-
93
-
94
-
95
-
96
-
97
-
98
-
99
-
100
-
101
-
102
-
103
-
104
-
105
-
106
-
107
-
108
-
109
-
110
-
111
-
112
-
113
-
114
-
115
-
116
-
117
-
118
-
119
-
120
-
121
-
122
-
123
-
124
-
125
-
126
-
127
-
128
-
129
-
130
-
131
-
132
-
133
-
134
-
135
-
136
-
137
-
138
-
139
-
140
-
141
-
142
-
143
-
144
-
145
-
146
-
147
-
148
-
149
-
150
-
151
-
152
 |
 |

14 Experian Annual Report 2009
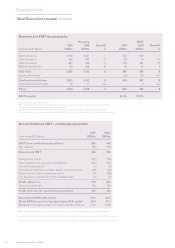
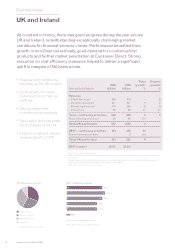
Total Organic
2009 2008 growth1 growth1
Year ended 31 March US$m US$m % %
Revenue
– Credit Services2 740 771 (4) (5)
– Decision Analytics2 119 118 1 1
– Marketing Services2 358 360 (1) (2)
– Interactive2 866 812 7 7
Total North America 2,083 2,061 1 1
EBIT
– Direct business 568 554 3
– FARES 48 54 (11)
Total North America 616 608 1
EBIT margin3 27.3% 26.9%
1 Growth at constant exchange rates
2 2008 restated for the reclassication of certain businesses between segments, see note 2 to the Group nancial statements
on page 78
3 EBIT margin is for continuing business only, excluding FARES
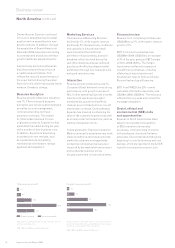
North America
Business review
Credit Services
Total revenue at Credit Services
declined by 4%, with organic revenue
down 5%. Prospecting activity by
nancial services clients remained
weak throughout the year, due to the
depressed market environment for
lending. Mortgage origination revenue
also declined, although there were
occasional surges in volumes linked
to consumer renancing activity.
These factors were partially offset by
growth in account management and
collections, with good traction from
new countercyclical products such
as bankruptcy scores and business
delinquency notication services.
In addition, there was a resilient
performance from the automotive
vertical, which beneted from market-
share gains in the sale of vehicle history
reports.
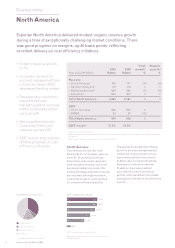
Experian North America delivered modest organic revenue growth
during a time of exceptionally challenging market conditions. There
was good progress on margins, up 40 basis points, reecting
excellent delivery on cost efciency initiatives.
• Organicrevenuegrowth
of 1%
• Increaseddemandfor
account management and
collections helps offset
depressed lending market
• Recessionaryconditions
impact traditional
marketing spend, but new
media businesses deliver
good growth
• Strongperformanceat
Consumer Direct with
revenue up over 20%
• EBITmarginimprovement
reects progress on cost
efciency initiatives
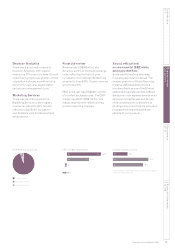
2009 Revenue by activity1
Decision Analytics
Credit Services
Marketing Services
Interactive
1 Excludes discontinuing activities
27.3%
26.9%
25.8%
EBIT (US$m) and margin
EBIT excludes discontinuing activities
EBIT margin is for continuing direct business only and
excludes FARES
23.3%
21.3%
09 616
08 608
07 573
06 473
05 356
EBIT