Entergy 2015 Annual Report Download - page 71
Download and view the complete annual report
Please find page 71 of the 2015 Entergy annual report below. You can navigate through the pages in the report by either clicking on the pages listed below, or by using the keyword search tool below to find specific information within the annual report.-
 1
1 -
2
-
3
-
4
-
5
-
6
-
7
-
8
-
9
-
10
-
11
-
12
-
13
-
14
-
15
-
16
-
17
-
18
-
19
-
20
-
21
-
22
-
23
-
24
-
25
-
26
-
27
-
28
-
29
-
30
-
31
-
32
-
33
-
34
-
35
-
36
-
37
-
38
-
39
-
40
-
41
-
42
-
43
-
44
-
45
-
46
-
47
-
48
-
49
-
50
-
51
-
52
-
53
-
54
-
55
-
56
-
57
-
58
-
59
-
60
-
 61
61 -
 62
62 -
 63
63 -
 64
64 -
 65
65 -
 66
66 -
 67
67 -
 68
68 -
 69
69 -
 70
70 -
 71
71 -
 72
72 -
 73
73 -
 74
74 -
 75
75 -
 76
76 -
 77
77 -
 78
78 -
 79
79
 |
 |

71
Clear vision, clear progress.
2015 Integrated Report
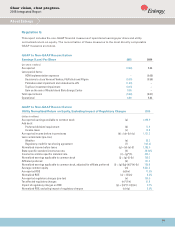
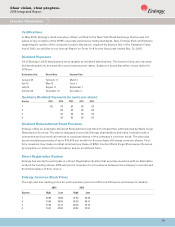
Regulation G
This report includes the non-GAAP financial measures of operational earnings per share and utility
normalized return on equity. The reconciliation of these measures to the most directly comparable
GAAP measures are below.
GAAP to Non-GAAP Reconciliation
Earnings (Loss) Per Share 2015 2014
(per share in dollars)
As-reported (0.99) 5.22
Less special items:
HCM implementation expenses – (0.05)
Decisions to close Vermont Yankee, FitzPatrick and Pilgrim (5.99) (0.56)
Palisades asset impairment and related write-offs (1.43) –
Top Deer investment impairment (0.13) –
Gain on the sale of Rhode Island State Energy Center 0.56 –
Total special items (6.99) (0.61)
Operational 6.00 5.83
GAAP to Non-GAAP Reconciliation
Utility Normalized Return on Equity, Excluding Impact of Regulatory Charges 2015
(dollars in millions)
As-reported earnings available to common stock (a) 1,096.9
Add back:
Preferred dividend requirement (b) 17.6
Income taxes (c) 16.8
As-reported income before income taxes (d) = (a)+(b)+(c) 1,131.3
Less certain items (pre-tax):
Weather (e) 56.3
Regulatory credit for tax sharing agreement (f) (107.0)
Normalized income before taxes (g) = (d)-(e)-(f) 1,182.0
State-specific standard income tax rate (h) 38.50%
Income tax at state-specific standard rate (i) = (g)*(h) 455.1
Normalized earnings applicable to common stock (j) = (g)-(i)-(b) 709.3
Affiliated preferred (k) 131.2
Normalized earnings applicable to common stock, adjusted for affiliate preferred (l) = (g)-[(g)-(k)]*(h)-(b) 759.8
Average common equity (m) 9,241.2
As-reported ROE (a)/(m) 11.9%
Normalized ROE (o) = (l)/(m) 8.2%
As-reported regulatory charges (pre-tax) (n) 100.5
Tax affected regulatory charges (n)*(1-h) 61.8
Impact of regulatory charges on ROE (p) = [(n)*(1-h)]/(m) 0.7%
Normalized ROE, excluding impact of regulatory charges (o)+(p) 8.9%
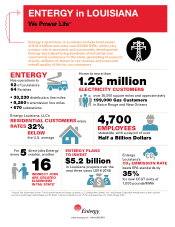
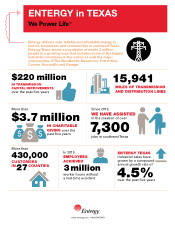
About Entergy