Entergy 2015 Annual Report Download - page 64
Download and view the complete annual report
Please find page 64 of the 2015 Entergy annual report below. You can navigate through the pages in the report by either clicking on the pages listed below, or by using the keyword search tool below to find specific information within the annual report.-
 1
1 -
2
-
3
-
4
-
5
-
6
-
7
-
8
-
9
-
10
-
11
-
12
-
13
-
14
-
15
-
16
-
17
-
18
-
19
-
20
-
21
-
22
-
23
-
24
-
25
-
26
-
27
-
28
-
29
-
30
-
31
-
32
-
33
-
34
-
35
-
36
-
37
-
38
-
39
-
40
-
41
-
42
-
43
-
44
-
45
-
46
-
47
-
48
-
49
-
50
-
51
-
52
-
53
-
 54
54 -
 55
55 -
 56
56 -
 57
57 -
 58
58 -
 59
59 -
 60
60 -
 61
61 -
 62
62 -
 63
63 -
 64
64 -
 65
65 -
 66
66 -
 67
67 -
 68
68 -
 69
69 -
 70
70 -
 71
71 -
 72
72 -
 73
73 -
 74
74 -
75
-
76
-
77
-
78
-
79
 |
 |
64
Clear vision, clear progress.
2015 Integrated Report
SOCIAL
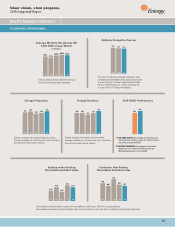
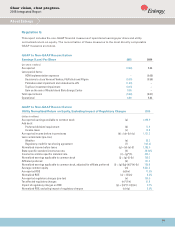
Key Performance Indicators
WHITE – 81%
OTHER – 1%
ASIAN – 1%
BLACK OR
AFRICAN AMERICAN – 15%
HISPANIC OR LATINO –2%
2015 Entergy Workforce
Ethnicity
BABY BOOMERS BORN 1943-1960 – 28%
GENERATION X BORN 1961-1981 – 52%
MILLENNIALS BORN 1982 AND AFTER – 20%
2015 Entergy Workforce
Age
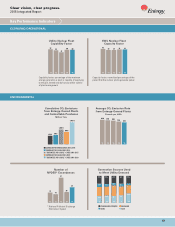
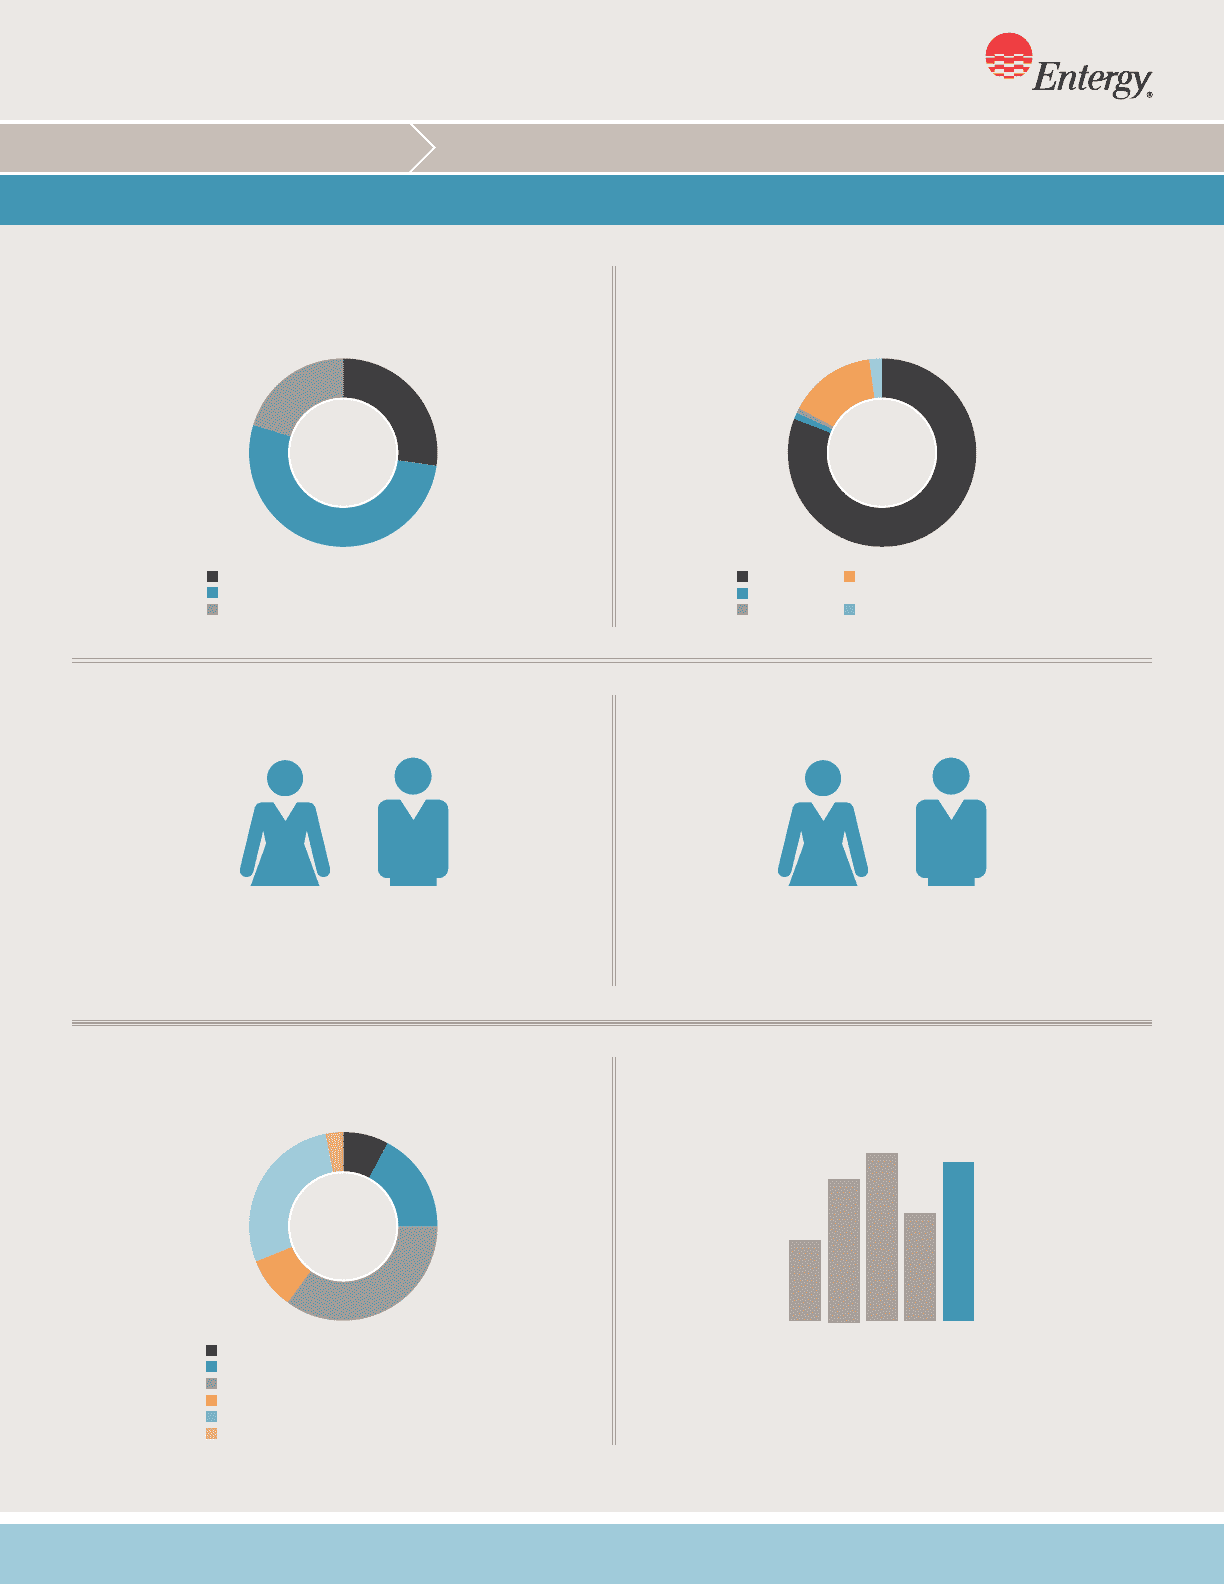
2015 Philanthropy
Invested More than $15 Million
ARTS & CULTURE – 8%
COMMUNITY IMPROVEMENT – 17%
EDUCATION/LITERACY – 35%
ENVIRONMENT – 9%
POVERTY SOLUTIONS/SOCIAL SERVICES – 28%
OTHER – 3%
Employee and
Retiree Volunteerism
Hours in Thousands
‘11 ‘12 ‘13 ‘14 ‘15
49
85
100
65
95
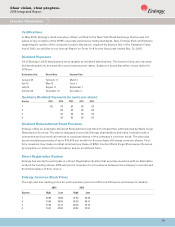
20% FEMALE 80% MALE
2015 Entergy Workforce
Gender
U.S. Bureau of Labor Statistics
2015 average for U.S. utilities:
Female 22% / Male 78%
13% FEMALE 87% MALE
2015 Entergy Management Workforce
Gender
Based on EEQ-1 Code