Entergy 2015 Annual Report Download - page 59
Download and view the complete annual report
Please find page 59 of the 2015 Entergy annual report below. You can navigate through the pages in the report by either clicking on the pages listed below, or by using the keyword search tool below to find specific information within the annual report.-
 1
1 -
2
-
3
-
4
-
5
-
6
-
7
-
8
-
9
-
10
-
11
-
12
-
13
-
14
-
15
-
16
-
17
-
18
-
19
-
20
-
21
-
22
-
23
-
24
-
25
-
26
-
27
-
28
-
29
-
30
-
31
-
32
-
33
-
34
-
35
-
36
-
37
-
38
-
39
-
40
-
41
-
42
-
43
-
44
-
45
-
46
-
47
-
48
-
 49
49 -
 50
50 -
 51
51 -
 52
52 -
 53
53 -
 54
54 -
 55
55 -
 56
56 -
 57
57 -
 58
58 -
 59
59 -
 60
60 -
 61
61 -
 62
62 -
 63
63 -
 64
64 -
 65
65 -
 66
66 -
 67
67 -
 68
68 -
 69
69 -
70
-
71
-
72
-
73
-
74
-
75
-
76
-
77
-
78
-
79
 |
 |

59
Clear vision, clear progress.
2015 Integrated Report
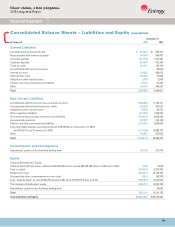
Consolidated Balance Sheets – Liabilities and Equity (unaudited)
December 31,
In Thousands 2015 2014
Current Liabilities
Currently maturing long-term debt $ 214,374 $ 899,375
Notes payable and commercial paper 494,348 598,407
Accounts payable 1,071,798 1,166,431
Customer deposits 419,407 412,166
Taxes accrued 210,077 128,108
Accumulated deferred income taxes – 38,039
Interest accrued 194,565 206,010
Deferred fuel costs 235,986 91,602
Obligations under capital leases 2,709 2,508
Pension and other postretirement liabilities 62,513 57,994
Other 184,181 248,251
Total 3,089,958 3,848,891
Non-Current Liabilities
Accumulated deferred income taxes and taxes accrued 8,306,865 9,133,161
Accumulated deferred investment tax credits 234,300 247,521
Obligations under capital leases 27,001 29,710
Other regulatory liabilities 1,414,898 1,383,609
Decommissioning and asset retirement cost liabilities 4,790,187 4,458,296
Accumulated provisions 460,727 418,128
Pension and other postretirement liabilities 3,187,357 3,638,295
Long-term debt (includes securitization bonds of $774,696 as of December 31, 2015,
and $776,817 as of December 31, 2014) 13,111,556 12,386,710
Other 449,856 557,649
Total 31,982,747 32,253,079
Commitments and Contingencies
Subsidiaries’ preferred stock without sinking fund 318,185 210,760
Equity
Common Shareholders’ Equity:
Common stock, $.01 par value, authorized 500,000,000 shares; issued 254,752,788 shares in 2015 and in 2014 2,548 2,548
Paid-in capital 5,403,758 5,375,353
Retained earnings 9,393,913 10,169,657
Accumulated other comprehensive income (loss) 8,951 (42,307)
Less – treasury stock, at cost (76,363,763 shares in 2015 and 75,512,079 shares in 2014) 5,552,379 5,497,526
Total common shareholders’ equity 9,256,791 10,007,725
Subsidiaries’ preferred stock without sinking fund – 94,000
Total 9,256,791 10,101,725
Total Liabilities and Equity $ 44,647,681 $ 46,414,455
Financial Highlights