Entergy 2015 Annual Report Download - page 62
Download and view the complete annual report
Please find page 62 of the 2015 Entergy annual report below. You can navigate through the pages in the report by either clicking on the pages listed below, or by using the keyword search tool below to find specific information within the annual report.-
 1
1 -
2
-
3
-
4
-
5
-
6
-
7
-
8
-
9
-
10
-
11
-
12
-
13
-
14
-
15
-
16
-
17
-
18
-
19
-
20
-
21
-
22
-
23
-
24
-
25
-
26
-
27
-
28
-
29
-
30
-
31
-
32
-
33
-
34
-
35
-
36
-
37
-
38
-
39
-
40
-
41
-
42
-
43
-
44
-
45
-
46
-
47
-
48
-
49
-
50
-
51
-
 52
52 -
 53
53 -
 54
54 -
 55
55 -
 56
56 -
 57
57 -
 58
58 -
 59
59 -
 60
60 -
 61
61 -
 62
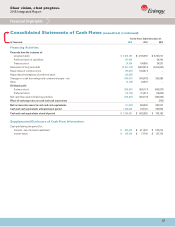
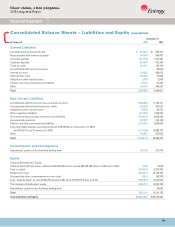
62 -
 63
63 -
 64
64 -
 65
65 -
 66
66 -
 67
67 -
 68
68 -
 69
69 -
 70
70 -
 71
71 -
 72
72 -
73
-
74
-
75
-
76
-
77
-
78
-
79
 |
 |
62
Clear vision, clear progress.
2015 Integrated Report
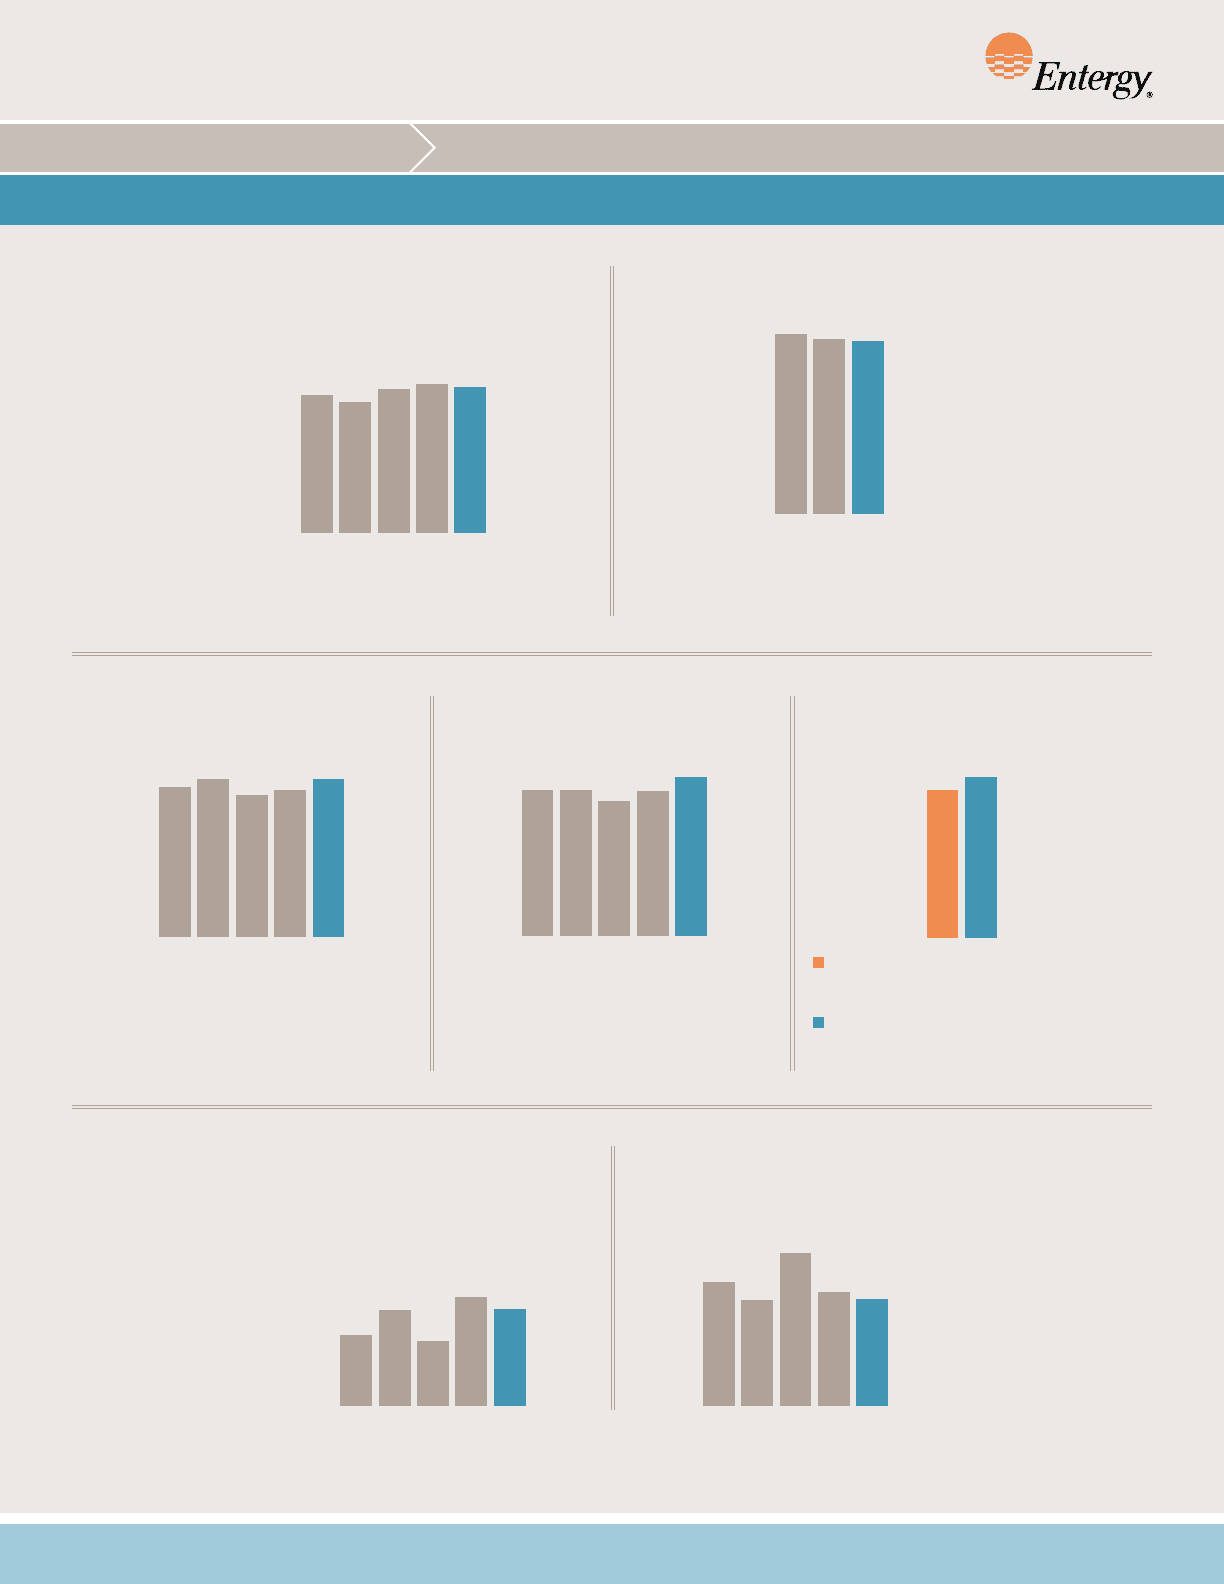
ECONOMIC/OPERATIONAL
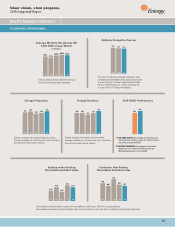
Key Performance Indicators
Percent of randomly selected customers who
responded to the Bellomy Perception Survey with
a score of 8, 9 or 10 when asked how satisfied
they are with Entergy as a utility company on
a scale of 0-10, 10 being the highest
‘13 ‘14 ‘15
77% 75% 74%
Bellomy Perception Survey
System average interruption frequency index:
average number per customer per year, excluding
the impact of major storm activity
‘11 ‘12 ‘13 ‘14 ‘15
1.61 1.68
1.52 1.58 1.69
Outage Frequency
Entergy utility system weighted average;
varies by utility operating company
‘11 ‘12 ‘13 ‘14 ‘15
96.46 91.58
101.02 104.26 102.15
Average Monthly Residential Bill
1,000 kWh Usage/Month
In Dollars
‘11 ‘12 ‘13 ‘14 ‘15
0.57
0.78
0.53
0.88 0.78
Employee Year-Ending
Recordable Accident Index
‘11 ‘12 ‘13 ‘14 ‘15
0.99
0.85
1.22
0.91 0.85
Contractor Year-Ending
Recordable Accident Index
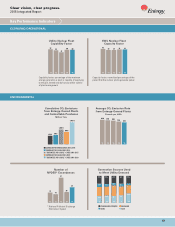
System average interruption duration index:
average minutes per customer per year, excluding
the impact of major storm activity
‘11 ‘12 ‘13 ‘14 ‘15
196 196 181 194
214
Outage Duration
70%
99%
2015 MISO Performance
ON-TIME STARTS: Percentage of generating unit
starts that were within or equal to +/-30 minutes of
the time instructed by MISO
ON-TIME STARTS: Percentage of generating unit
starts that were within or equal to +/-30 minutes of
the time instructed by MISO
WITHIN TRAMLINES: Percentage of time fossil
generating units remained within the desired
MW load bandwidth as set by MISO
WITHIN TRAMLINES: Percentage of time fossil
generating units remained within the desired
MW load bandwidth as set by MISO
Recordable accident index: number of recordable accidents per 100 full-time equivalents
Recordable accidents include fatalities, lost-time accidents, restricted duty accidents and medical attentions