Dollar Tree 2010 Annual Report Download - page 48
Download and view the complete annual report
Please find page 48 of the 2010 Dollar Tree annual report below. You can navigate through the pages in the report by either clicking on the pages listed below, or by using the keyword search tool below to find specific information within the annual report.-
 1
1 -
2
-
3
-
4
-
5
-
6
-
7
-
8
-
9
-
10
-
11
-
12
-
13
-
14
-
15
-
16
-
17
-
18
-
19
-
20
-
21
-
22
-
23
-
24
-
25
-
26
-
27
-
28
-
29
-
30
-
31
-
32
-
33
-
34
-
35
-
36
-
37
-
 38
38 -
 39
39 -
 40
40 -
 41
41 -
 42
42 -
 43
43 -
 44
44 -
 45
45 -
 46
46 -
 47
47 -
 48
48 -
 49
49 -
 50
50 -
 51
51 -
 52
52
 |
 |

Notes to Consolidated Financial Statements
The following tables summarize the Company’s various option plans and information about options outstanding
at January 29, 2011 and changes during the year then ended.
Stock Option Activity
January 29, 2011
Shares
Weighted
Average
Per Share
Exercise Price
Weighted
Average
Remaining
Ter m
Aggregate
Intrinsic Value
(in millions)
Outstanding, beginning of period 1,840,259 $ 19.34
Granted 10,462 46.52
Exercised (798,098) 20.04
Forfeited (30,552) 16.37
Outstanding, end of period 1,022,071 $ 19.16 4.6 $ 19.6
Options vested and expected to vest
at January 29, 2011 1,022,071 $ 19.16 4.6 $ 19.6
Options exercisable at end of period 791,177 $ 18.80 3.8 $ 25.5
Options Outstanding Options Exercisable
Range of Exercise Prices
Options
Outstanding
at January 29,
2011
Weighted
Average
Remaining
Contractual Life
Weighted
Average
Exercise
Price
Options
Exercisable
at January 29,
2011
Weighted
Average
Exercise
Price
$0.57 1,555 N/A $ 0.57 1,555 $ 0.57
$0.58 to $14.18 199,305 1.9 13.12 199,305 13.12
$14.19 to $19.86 486,314 5.2 17.55 321,171 17.39
$19.87 to $29.04 318,910 5.0 24.35 253,159 23.74
$29.05 to $32.24 5,525 8.8 32.22 5,525 32.22
$32.25 to $56.08 10,462 9.6 46.52 10,462 46.52
$0.57 to $56.08 1,022,071 4.6 $ 19.16 791,177 $ 18.80
The intrinsic value of options exercised during 2010, 2009 and 2008 was approximately $16.0 million,
$11.0 million and $7.2 million, respectively.
recognized $0.5 million of expense on these stock
options in 2009 and in 2008. The fair value of these
stock options was determined using the Company’s
closing stock price on the grant date.
The fair value of each option grant was estimated
on the date of grant using the Black-Scholes option-
pricing model. The expected term of the awards
granted was calculated using the “simplifi ed method”
in accordance with Staff Accounting Bulletin No.
107. Expected volatility is derived from an analysis of
the historical and implied volatility of the Company’s
publicly traded stock. The risk free rate is based on the
U.S. Treasury rates on the grant date with maturity
dates approximating the expected life of the option on
the grant date. The weighted average assumptions used
in the Black-Scholes option pricing model for grants
in 2008 are as follows. The 2010 and 2009 amounts are
immaterial.
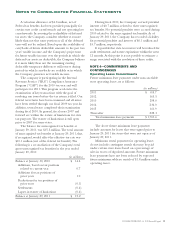
Fiscal 2008
Expected term in years 6.0
Expected volatility 45.7%
Annual dividend yield —
Risk free interest rate 2.8%
Weighted average fair value of
options granted during the period $8.97
Options granted 837.440
46 DOLLAR TREE, INC. ♦ 2010 Annual Report