Dollar Tree 2010 Annual Report Download - page 3
Download and view the complete annual report
Please find page 3 of the 2010 Dollar Tree annual report below. You can navigate through the pages in the report by either clicking on the pages listed below, or by using the keyword search tool below to find specific information within the annual report.-
 1
1 -
 2
2 -
 3
3 -
 4
4 -
 5
5 -
 6
6 -
 7
7 -
 8
8 -
 9
9 -
 10
10 -
 11
11 -
 12
12 -
 13
13 -
 14
14 -
15
-
16
-
17
-
18
-
19
-
20
-
21
-
22
-
23
-
24
-
25
-
26
-
27
-
28
-
29
-
30
-
31
-
32
-
33
-
34
-
35
-
36
-
37
-
38
-
39
-
40
-
41
-
42
-
43
-
44
-
45
-
46
-
47
-
48
-
49
-
50
-
51
-
52
 |
 |

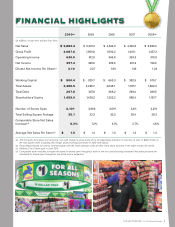
2010(a) 2009 2008 2007 2006(b)
(in millions, except store and per share data)
Net Sales $ 5,882.4 $ 5,231.2 $ 4,644.9 $ 4,242.6 $ 3,969.4
Gross Profi t 2,087.6 1,856.8 1,592.2 1,461.1 1,357.2
Operating Income 630.0 512.8 365.8 330.3 310.8
Net Income 397.3 320.5 229.5 201.3 192.0
Diluted Net Income Per Share(c) 3.10 2.37 1.69 1.39 1.23
Working Capital $ 800.4 $ 829.7 $ 663.3 $ 382.9 $ 575.7
Total Assets 2,380.5 2,289.7 2,035.7 1,787.7 1,882.2
Total Debt 267.8 267.8 268.2 269.4 269.5
Shareholders’ Equity 1,459.0 1,429.2 1,253.2 988.4 1,167.7
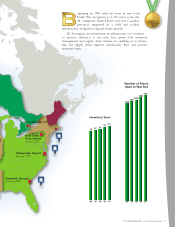
Number of Stores Open 4,101 3,806 3,591 3,411 3,219
Total Selling Square Footage 35.1 32.3 30.3 28.4 26.3
Comparable Store Net Sales
Increase(d) 6.3% 7.2% 4.1% 2.7% 4.6%
Average Net Sales Per Store(d) $ 1.5 $ 1.4 $ 1.3 $ 1.3 $ 1.3
(a) The Company recorded a non-recurring, non-cash charge to gross profi t and a corresponding reduction in inventory, at cost, of $26.3 million in
the fi rst quarter 2010. Excluding this charge, diluted earnings per share in 2010 were $3.23.
(b) Fiscal 2006 includes 53 weeks, commensurate with the retail calendar, while all other fi scal years reported in the table contain 52 weeks.
(c) Refl ects 3 for 2 stock split in June 2010.
(d) Comparable store net sales compare net sales for stores open throughout each of the two periods being compared. Net sales per store are
calculated for stores open throughout the entire period presented.
FINANCIAL HIGHLIGHTS
DOLLAR TREE, INC. ♦ 2010 Annual Report 1