Dollar Tree 2010 Annual Report Download - page 32
Download and view the complete annual report
Please find page 32 of the 2010 Dollar Tree annual report below. You can navigate through the pages in the report by either clicking on the pages listed below, or by using the keyword search tool below to find specific information within the annual report.-
 1
1 -
2
-
3
-
4
-
5
-
6
-
7
-
8
-
9
-
10
-
11
-
12
-
13
-
14
-
15
-
16
-
17
-
18
-
19
-
20
-
21
-
 22
22 -
 23
23 -
 24
24 -
 25
25 -
 26
26 -
 27
27 -
 28
28 -
 29
29 -
 30
30 -
 31
31 -
 32
32 -
 33
33 -
 34
34 -
 35
35 -
 36
36 -
 37
37 -
 38
38 -
 39
39 -
 40
40 -
 41
41 -
 42
42 -
43
-
44
-
45
-
46
-
47
-
48
-
49
-
50
-
51
-
52
 |
 |

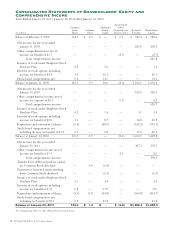
(in millions)
Common
Stock
Shares
Common
Stock
Additional
Paid-in
Capital
Accumulated
Other
Comprehensive
Income (Loss)
Retained
Earnings
Shareholders’
Equity
Balance at February 2, 2008 134.7 $ 0.9 $ — $ 0.1 $ 987.4 $ 988.4
Net income for the year ended
January 31, 2009 ———— 229.5 229.5
Other comprehensive loss, net of
income tax benefi t of $1.7 — — — (2.7) — (2.7)
Total comprehensive income 226.8
Issuance of stock under Employee Stock
Purchase Plan
0.2 — 3.6 — — 3.6
Exercise of stock options, including
income tax benefi t of $2.3
1.0 — 20.3 — — 20.3
Stock-based compensation, net
0.2 — 14.1 — — 14.1
Balance at January 31, 2009
136.1 0.9 38.0 (2.6) 1,216.9 1,253.2
Net income for the year ended
January 30, 2010 ———— 320.5 320.5
Other comprehensive income, net of
income tax expense of $0.1 — — — 0.2 — 0.2
Total comprehensive income 320.7
Issuance of stock under Employee Stock
Purchase Plan
0.2 — 1.4 — 3.1 4.5
Exercise of stock options, including
income tax benefi t of $2.0
1.1 — 8.7 — 14.8 23.5
Repurchase and retirement of shares
(6.4) — (48.9) — (144.2) (193.1)
Stock-based compensation, net,
including income tax benefi t of $1.9 0.3 — 0.8 — 19.6 20.4
Balance at January 30, 2010 131.3 0.9 — (2.4) 1,430.7 1,429.2
Net income for the year ended
January 29, 2011 ———— 397.3 397.3
Other comprehensive income, net of
income tax benefi t of $1.3 — — — 2.0 — 2.0
Total comprehensive income 399.3
Transfer from additional paid-in capital
for Common Stock dividend — 0.4 (0.4) — — —
Payment for fractional shares resulting
from Common Stock dividend — — (0.3) — — (0.3)
Issuance of stock under Employee Stock
Purchase Plan 0.1 —
4.4 — — 4.4
Exercise of stock options, including
income tax benefi t of $1.9 0.8 — 17.9 — — 17.9
Repurchase and retirement of shares (9.3) (0.1) (44.8) — (369.8) (414.7)
Stock-based compensation, net,
including tax benefi t of $5.9 0.5 — 23.2 — — 23.2
Balance at January 29, 2011 123.4 $ 1.2 $ — $ (0.4) $ 1,458.2 $ 1,459.0
See accompanying Notes to Consolidated Financial Statements.
Consolidated Statements of Shareholders’ Equity and
Comprehensive Income
Years Ended January 29, 2011, January 30, 2010, And January 31, 2009
30 DOLLAR TREE, INC. ♦ 2010 Annual Report