Dollar Tree 2010 Annual Report Download - page 18
Download and view the complete annual report
Please find page 18 of the 2010 Dollar Tree annual report below. You can navigate through the pages in the report by either clicking on the pages listed below, or by using the keyword search tool below to find specific information within the annual report.-
 1
1 -
2
-
3
-
4
-
5
-
6
-
7
-
 8
8 -
 9
9 -
 10
10 -
 11
11 -
 12
12 -
 13
13 -
 14
14 -
 15
15 -
 16
16 -
 17
17 -
 18
18 -
 19
19 -
 20
20 -
 21
21 -
 22
22 -
 23
23 -
 24
24 -
 25
25 -
 26
26 -
 27
27 -
 28
28 -
29
-
30
-
31
-
32
-
33
-
34
-
35
-
36
-
37
-
38
-
39
-
40
-
41
-
42
-
43
-
44
-
45
-
46
-
47
-
48
-
49
-
50
-
51
-
52
 |
 |

Our point-of-sale technology provides us with
valuable sales and inventory information to assist our
buyers and improve our merchandise allocation to our
stores. We believe that this has enabled us to better
manage our inventory fl ow resulting in more effi cient
distribution and store operations and increased inven-
tory turnover for each of the last fi ve years. Inventory
turnover improved by approximately 10 basis points
in 2010.
In 2007, legislation was enacted that increased the
Federal Minimum Wage. The last increase to $7.25 an
hour was effective in July 2009. As a result, our wages
have increased in the third quarter of 2009 through
the fi rst half of 2010; however, we offset the increase
in payroll costs through increased productivity and
continued effi ciencies in product fl ow to our stores.
We must continue to control our merchandise
costs, inventory levels and our general and administra-
tive expenses as increases in these line items could
negatively impact our operating results.
Management’s Discussion And Analysis
Of Financial Condition And Results Of Operations
merchandise in approximately 1,840 stores compared
to approximately 1,400 stores at January 30, 2010. We
believe that the addition of frozen and refrigerated
product enables us to increase sales and earnings by
increasing the number of shopping trips made by
our customers. In addition, we accept food stamps
(under the Supplemental Nutrition Assistance Program
(“SNAP”)) in approximately 3,500 qualifi ed stores
compared to 2,900 at the end of 2009.
With the pressures of the current economic
environment, we have seen increases in the demand
for basic, consumable products in 2010. As a result, we
have continued to shift the mix of inventory carried
in our stores to more consumer product merchandise
which we believe increases the traffi c in our stores
and has helped to increase our sales even during the
current economic downturn. While this shift in mix
has impacted our merchandise costs we were able to
offset that impact in the current year with decreased
costs for merchandise in many of our categories.
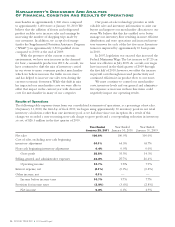
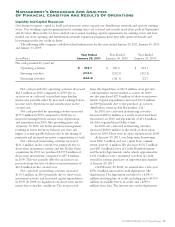
Results of Operations
The following table expresses items from our consolidated statements of operations, as a percentage of net sales.
On January 31, 2010, the fi rst day of fi scal 2010, we began using approximately 30 inventory pools in our retail
inventory calculation, rather than one inventory pool as we had done since our inception. As a result of this
change, we recorded a non-recurring, non-cash charge to gross profi t and a corresponding reduction in inventory,
at cost, of $26.3 million in the fi rst quarter of 2010.
Year Ended
January 29, 2011
Yea r E nd ed
January 30, 2010
Yea r E nd ed
January 31, 2009
Net sales 100.0% 100.0% 100.0%
Cost of sales, excluding non-cash beginning
inventory adjustment 64.1% 64.5% 65.7%
Non-cash beginning inventory adjustment 0.4% 0.0% 0.0%
Gross profi t 35.5% 35.5% 34.3%
Selling, general and administrative expenses 24.8% 25.7% 26.4%
Operating income 10.7% 9.8 % 7.9 %
Interest expense, net (0.1%) (0.1%) (0.2%)
Other income, net 0.1% — —
Income before income taxes 10.7% 9.7% 7.7 %
Provision for income taxes (3.9%) (3.6%) (2.8%)
Net income 6.8% 6.1% 4.9%
16 DOLLAR TREE, INC. ♦ 2010 Annual Report