Dollar Tree 2010 Annual Report Download - page 19
Download and view the complete annual report
Please find page 19 of the 2010 Dollar Tree annual report below. You can navigate through the pages in the report by either clicking on the pages listed below, or by using the keyword search tool below to find specific information within the annual report.-
 1
1 -
2
-
3
-
4
-
5
-
6
-
7
-
8
-
 9
9 -
 10
10 -
 11
11 -
 12
12 -
 13
13 -
 14
14 -
 15
15 -
 16
16 -
 17
17 -
 18
18 -
 19
19 -
 20
20 -
 21
21 -
 22
22 -
 23
23 -
 24
24 -
 25
25 -
 26
26 -
 27
27 -
 28
28 -
 29
29 -
30
-
31
-
32
-
33
-
34
-
35
-
36
-
37
-
38
-
39
-
40
-
41
-
42
-
43
-
44
-
45
-
46
-
47
-
48
-
49
-
50
-
51
-
52
 |
 |

Management’s Discussion And Analysis
Of Financial Condition And Results Of Operations
Fiscal year ended January 29, 2011 compared
to fi scal year ended January 30, 2010
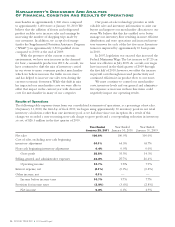
Net Sales. Net sales increased 12.4%, or $651.2 million,
in 2010 compared to 2009, resulting from a 6.3%
increase in comparable store net sales and sales in our
new stores. Comparable store net sales are positively
affected by our expanded and relocated stores, which
we include in the calculation, and, to a lesser extent, are
negatively affected when we open new stores or expand
stores near existing ones.
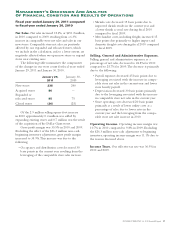
The following table summarizes the components
of the changes in our store count for fi scal years ended
January 29, 2011 and January 30, 2010.
January 29,
2011
January 30,
2010
New stores 235 240
Acquired stores 86 —
Expanded or
relocated stores 95 75
Closed stores (26) (25)
Of the 2.9 million selling square foot increase
in 2010 approximately 0.4 million was added by
expanding existing stores and 0.7 million was the result
of the acquisition of the Dollar Giant stores.
Gross profi t margin was 35.5% in 2010 and 2009.
Excluding the effect of the $26.3 million non-cash
beginning inventory adjustment, gross profi t margin
increased to 35.9%. This increase was due to the
following:
• Occupancy and distribution costs decreased 30
basis points in the current year resulting from the
leveraging of the comparable store sales increase.
• Shrink costs decreased 15 basis points due to
improved shrink results in the current year and
a lower shrink accrual rate during fi scal 2010
compared to fi scal 2009.
• Merchandise costs, including freight, increased 15
basis points due primarily to higher import and
domestic freight costs during fi scal 2010 compared
to fi scal 2009.
Selling, General and Administrative Expenses.
Selling, general and administrative expenses, as a
percentage of net sales, decreased to 24.8% for 2010
compared to 25.7% for 2009. The decrease is primarily
due to the following:
• Payroll expenses decreased 45 basis points due to
leveraging associated with the increase in compa-
rable store net sales in the current year and lower
store hourly payroll.
• Depreciation decreased 30 basis points primarily
due to the leveraging associated with the increase
in comparable store net sales in the current year.
• Store operating costs decreased 20 basis points
primarily as a result of lower utility costs as a
percentage of sales, due to lower rates in the
current year and the leveraging from the compa-
rable store net sales increase in 2010.
Operating Income. Operating income margin was
10.7% in 2010 compared to 9.8% in 2009. Excluding
the $26.3 million non-cash adjustment to beginning
inventory, operating income margin was 11.1% due to
the reasons discussed above.
Income Taxes. Our effective tax rate was 36.9% in
2010 and 2009.
DOLLAR TREE, INC. ♦ 2010 Annual Report 17