Dollar Tree 2010 Annual Report Download - page 21
Download and view the complete annual report
Please find page 21 of the 2010 Dollar Tree annual report below. You can navigate through the pages in the report by either clicking on the pages listed below, or by using the keyword search tool below to find specific information within the annual report.-
 1
1 -
2
-
3
-
4
-
5
-
6
-
7
-
8
-
9
-
10
-
 11
11 -
 12
12 -
 13
13 -
 14
14 -
 15
15 -
 16
16 -
 17
17 -
 18
18 -
 19
19 -
 20
20 -
 21
21 -
 22
22 -
 23
23 -
 24
24 -
 25
25 -
 26
26 -
 27
27 -
 28
28 -
 29
29 -
 30
30 -
 31
31 -
32
-
33
-
34
-
35
-
36
-
37
-
38
-
39
-
40
-
41
-
42
-
43
-
44
-
45
-
46
-
47
-
48
-
49
-
50
-
51
-
52
 |
 |

Management’s Discussion And Analysis
Of Financial Condition And Results Of Operations
from this liquidation of $40.5 million were put into
cash equivalent money market accounts. In 2009,
we also purchased $27.8 million of short-term invest-
ments. Capital expenditures increased $33.5 million
in 2009 primarily due to the purchase of our new
distribution center in San Bernardino, CA.
In 2010, net cash used in fi nancing activities
increased $243.0 million as a result of increased share
repurchases in 2010 and repayments of $13.8 million
for debt acquired from Dollar Giant.
In 2009, net cash used in fi nancing activities
increased $184.0 million as the result of share repur-
chases in 2009. There were no share repurchases in 2008.
At January 29, 2011, our long-term borrowings
were $266.5 million and our capital lease commit-
ments were $1.4 million. We also have $121.5 million
and $50.0 million Letter of Credit Reimbursement
and Security Agreements, under which approximately
$106.9 million were committed to letters of credit
issued for routine purchases of imported merchandise
at January 29, 2011.
On February 20, 2008, we entered into a fi ve-year
$550.0 million unsecured Credit Agreement (the
Agreement). The Agreement provides for a $300.0
million revolving line of credit, including up to $150.0
million in available letters of credit, and a $250.0
million term loan. The interest rate on the Agreement
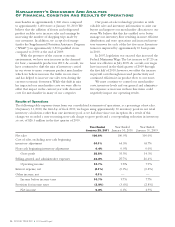
Net cash provided by operating activities decreased
$62.3 million in 2010 compared to 2009 due to
an increase in cash used to purchase merchandise
inventories partially offset by increased earnings before
income taxes, depreciation and amortization in the
current year.
Net cash provided by operating activities increased
$177.9 million in 2009 compared to 2008 due to
increased earnings before income taxes, depreciation
and amortization in 2009. Also providing more cash
at January 30, 2010 was better inventory management
resulting in lower inventory balances per store and
higher accounts payable balances due to the timing of
payments and increased incentive compensation accruals.
Net cash used in investing activities increased
$161.6 million in the current year primarily due to
short-term investment activity and the Dollar Giant
acquisition. In 2010 we purchased $157.8 million of
short-term investments compared to $27.8 million
in 2009. This was partially offset by an increase in
proceeds from the sales of short-term investments of
$10.8 million in the current year.
Net cash used in investing activities increased
$110.5 million in 2009 primarily due to short-term
investment activity and increased capital expenditures
in 2009. In 2008 we liquidated our short-term invest-
ments due to market conditions. The net proceeds
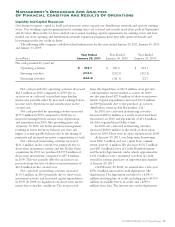
Liquidity and Capital Resources
Our business requires capital to build and open new stores, expand our distribution network and operate existing
stores. Our working capital requirements for existing stores are seasonal and usually reach their peak in September
and October. Historically, we have satisfi ed our seasonal working capital requirements for existing stores and have
funded our store opening and distribution network expansion programs from internally generated funds and
borrowings under our credit facilities.
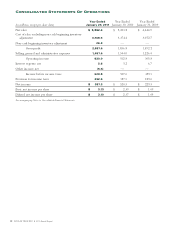
The following table compares cash-fl ow related information for the years ended January 29, 2011, January 30, 2010
and January 31, 2009:
(in millions)
Year Ended
January 29, 2011
Yea r E nd ed
January 30, 2010
Yea r E nd ed
January 31, 2009
Net cash provided by (used in):
Operating activities $ 518.7 $ 581.0 $ 403.1
Investing activities (374.1) (212.5) (102.0)
Financing activities (404.3) (161.3) 22.7
DOLLAR TREE, INC. ♦ 2010 Annual Report 19