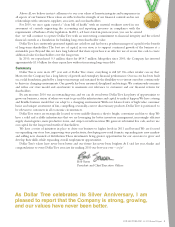
Dollar Tree 2010 Annual Report Download - page 17
Download and view the complete annual report
Please find page 17 of the 2010 Dollar Tree annual report below. You can navigate through the pages in the report by either clicking on the pages listed below, or by using the keyword search tool below to find specific information within the annual report.-
 1
1 -
2
-
3
-
4
-
5
-
6
-
 7
7 -
 8
8 -
 9
9 -
 10
10 -
 11
11 -
 12
12 -
 13
13 -
 14
14 -
 15
15 -
 16
16 -
 17
17 -
 18
18 -
 19
19 -
 20
20 -
 21
21 -
 22
22 -
 23
23 -
 24
24 -
 25
25 -
 26
26 -
 27
27 -
28
-
29
-
30
-
31
-
32
-
33
-
34
-
35
-
36
-
37
-
38
-
39
-
40
-
41
-
42
-
43
-
44
-
45
-
46
-
47
-
48
-
49
-
50
-
51
-
52
 |
 |
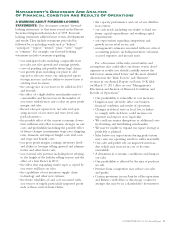
Management’s Discussion And Analysis
Of Financial Condition And Results Of Operations
Overview
Our net sales are derived from the sale of merchandise.
Two major factors tend to affect our net sales trends.
First is our success at opening new stores or adding
new stores through acquisitions. Second, sales vary at
our existing stores from one year to the next. We refer
to this change as a change in comparable store net
sales, because we compare only those stores that are
open throughout both of the periods being compared.
We include sales from stores expanded during the year
in the calculation of comparable store net sales, which
has the effect of increasing our comparable store net
sales. The term ‘expanded’ also includes stores that
are relocated.
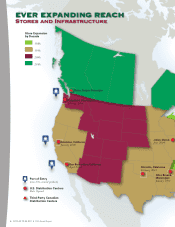
At January 29, 2011, we operated 4,101 stores in
48 states and the District of Columbia, as well as the
Canadian provinces of British Columbia, Ontario,
Alberta and Saskatchewan, with 35.1 million selling
square feet compared to 3,806 stores with 32.3 million
selling square feet at January 30, 2010. During fi scal
2010, we opened 235 stores, expanded 95 stores,
acquired 86 stores and closed 26 stores, compared to
240 new stores opened, 75 stores expanded and 25
stores closed during fi scal 2009. In the current year
we increased our selling square footage by 8.8%.
Of the 2.8 million selling square foot increase in 2010,
0.4 million was added by expanding existing stores
and 0.7 million was added with the acquisition of
Dollar Giant. The average size of our stores opened in
2010 was approximately 8,400 selling square feet (or
about 10,200 gross square feet). For 2011, we continue
to plan to open stores that are approximately 8,000 –
10,000 selling square feet (or about 10,000 –12,000
gross square feet). We believe that this store size is our
optimal size operationally and that this size also gives
our customers an ideal shopping environment that
invites them to shop longer and buy more.
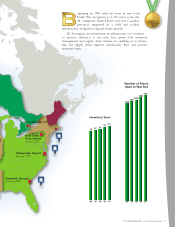
In fi scal 2010, comparable store net sales increased
by 6.3%. The comparable store net sales increase was
primarily the result of a 5.0% increase in the number
of transactions and a 1.3% increase in average ticket.
We believe comparable store net sales continued to be
positively affected by a number of our initiatives, as
debit and credit card penetration continued to increase
in 2010, and we continued the roll-out of frozen
and refrigerated merchandise to more of our stores.
At January 29, 2011, we had frozen and refrigerated
• On May 26, 2010, the Company’s Board of
Directors approved a 3-for-2 stock split in the
form of a 50% common stock dividend. New
shares were distributed on June 24, 2010 to share-
holders of record as of the close of business on
June 10, 2010. As a result, all share and per share
data in this Annual Report have been retroactively
adjusted to refl ect this dividend having the effect
of a 3-for-2 stock split.
• We assign cost to store inventories using the retail
inventory method, determined on a weighted
average cost basis. From our inception and through
fi scal 2009, we used one inventory pool for this
calculation. Because of our investments over the
years in our retail technology systems, we were
able to refi ne our estimate of inventory cost under
the retail method and on January 31, 2010, the fi rst
day of fi scal 2010, we began using approximately
30 inventory pools in our retail inventory calcula-
tion. As a result of this change, we recorded a
non-recurring, non-cash charge to gross profi t and
a corresponding reduction in inventory, at cost, of
$26.3 million in the fi rst quarter of 2010. This was
a prospective change and did not have any effect
on prior periods.
• On November 2, 2009, we purchased a new
distribution center in San Bernardino, California.
We have spent approximately $31.0 million in
capital expenditures for this new distribution
center during fi scal 2009 and an additional $5.7
million in fi scal 2010. This new distribution center
replaced our Salt Lake City, Utah leased facility
whose lease ended in April 2010.
• On February 20, 2008, we entered into a fi ve-
year $550.0 million unsecured Credit Agreement
(the Agreement). The Agreement provides for a
$300.0 million revolving line of credit, including
up to $150.0 million in available letters of credit,
and a $250.0 million term loan. The interest rate
on the facility is based, at our option, on a LIBOR
rate, plus a margin, or an alternate base rate, plus
a margin.
DOLLAR TREE, INC. ♦ 2010 Annual Report 15