Dollar Tree 2009 Annual Report Download - page 48
Download and view the complete annual report
Please find page 48 of the 2009 Dollar Tree annual report below. You can navigate through the pages in the report by either clicking on the pages listed below, or by using the keyword search tool below to find specific information within the annual report.-
 1
1 -
2
-
3
-
4
-
5
-
6
-
7
-
8
-
9
-
10
-
11
-
12
-
13
-
14
-
15
-
16
-
17
-
18
-
19
-
20
-
21
-
22
-
23
-
24
-
25
-
26
-
27
-
28
-
29
-
30
-
31
-
32
-
33
-
34
-
35
-
36
-
37
-
 38
38 -
 39
39 -
 40
40 -
 41
41 -
 42
42 -
 43
43 -
 44
44 -
 45
45 -
 46
46 -
 47
47 -
 48
48 -
 49
49 -
 50
50 -
 51
51 -
 52
52
 |
 |

Notes to Consolidated Financial Statements
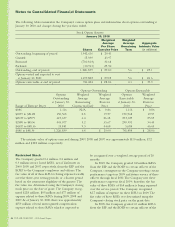
Restricted Stock
TheCompanygranted0.4million,0.4millionand
0.3millionservicebasedRSUs,netofforfeituresin
2009,2008and2007,respectively,fromtheEIPandthe
EOEPtotheCompany’semployeesandofcers.The
fair value of all of these RSUs is being expensed ratably
over the three-year vesting periods, or a shorter period
based on the retirement eligibility of the grantee. The
fairvaluewasdeterminedusingtheCompany’sclosing
stock price on the date of grant. The Company recog-
nized$12.8million,$9.5millionand$7.7millionof
expenserelatedtotheseRSUsduring2009,2008and
2007.AsofJanuary30,2010,therewasapproximately
$15.9millionoftotalunrecognizedcompensation
expense related to these RSUs which is expected to
berecognizedoveraweightedaverageperiodof20
months.
In2009,theCompanygranted0.2millionRSUs
fromtheEIPandtheEOEPtocertainofcersofthe
Company, contingent on the Company meeting certain
performancetargetsin2009andfutureserviceofthese
ofcersthroughscal2010.TheCompanymetthese
performancetargetsinscal2009;therefore,thefair
valueoftheseRSUsof$6.4millionisbeingexpensed
overtheserviceperiod.TheCompanyrecognized
$2.7millionofexpenseontheseRSUsin2009.The
fair value of these RSUs was determined using the
Company’sclosingstockpriceonthegrantdate.
In2008,theCompanygranted0.1millionRSUs
fromtheEIPandtheEOEPtocertainofcersofthe
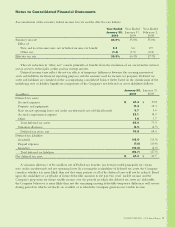
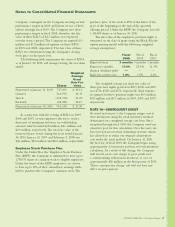
ThefollowingtablessummarizetheCompany’svariousoptionplansandinformationaboutoptionsoutstandingat
January30,2010andchangesduringtheyearthenended.
Stock Option Activity
January 30, 2010
Shares
Weighted
Average
Per Share
Exercise Price
Weighted
Average
Remaining
Term
Aggregate
Intrinsic Value
(in millions)
Outstanding, beginning of period 1,942,616 $ 29.41
Granted 15,939 43.97
Exercised (700,803) 30.68
Forfeited (30,913) 25.50
Outstanding, end of period 1,226,839 $ 29.00 5.6 $ 25.1
Options vested and expected to vest
atJanuary30,2010 1,199,882 $ 29.05 5.6 $ 24.6
Options exercisable at end of period 741,484 $ 28.06 4.1 $ 15.9
Options Outstanding Options Exercisable
Range of Exercise Prices
Options
Outstanding
atJanuary30,
2010
Weighted
Average
Remaining
Contractual Life
Weighted
Average
Exercise
Price
Options
Exercisable
atJanuary30,
2010
Weighted
Average
Exercise
Price
$0.86 1,116 N/A $ 0.86 1,116 $ 0.86
$10.99to$21.28 150,568 2.8 19.57 150,568 19.57
$21.29to$29.79 615,637 6.4 26.12 293,125 25.85
$29.80to$43.56 445,677 5.2 35.67 290,991 34.43
$43.57to$48.36 13,841 9.3 44.68 5,684 46.65
$0.86to$48.36 1,226,839 6.4 $ 29.00 741,484 $ 28.06
Theintrinsicvalueofoptionsexercisedduring2009,2008and2007wasapproximately$11.0million,$7.2
millionand$32.8million,respectively.
46DOLLARTREE,INC.•2009AnnualReport