Dollar Tree 2009 Annual Report Download - page 19
Download and view the complete annual report
Please find page 19 of the 2009 Dollar Tree annual report below. You can navigate through the pages in the report by either clicking on the pages listed below, or by using the keyword search tool below to find specific information within the annual report.-
 1
1 -
2
-
3
-
4
-
5
-
6
-
7
-
8
-
 9
9 -
 10
10 -
 11
11 -
 12
12 -
 13
13 -
 14
14 -
 15
15 -
 16
16 -
 17
17 -
 18
18 -
 19
19 -
 20
20 -
 21
21 -
 22
22 -
 23
23 -
 24
24 -
 25
25 -
 26
26 -
 27
27 -
 28
28 -
 29
29 -
30
-
31
-
32
-
33
-
34
-
35
-
36
-
37
-
38
-
39
-
40
-
41
-
42
-
43
-
44
-
45
-
46
-
47
-
48
-
49
-
50
-
51
-
52
 |
 |

Management’s Discussion And Analysis Of Financial Condition
And Results Of Operations
Fiscal year ended January 30, 2010 compared
to fiscal year ended January 31, 2009
Net Sales.Netsalesincreased12.6%,or$586.3
million,in2009comparedto2008,resultingfroma
7.2%increaseincomparablestorenetsalesandsalesin
our new stores. Comparable store net sales are positively
affected by our expanded and relocated stores, which
we include in the calculation, and, to a lesser extent, are
negatively affected when we open new stores or expand
stores near existing ones.
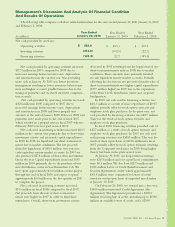
Thefollowingtablesummarizesthecomponents
ofthechangesinourstorecountforscalyearsended
January30,2010andJanuary31,2009.
January 30,
2010
January31,
2009
New stores 240 227
Acquired leases —4
Expanded or
relocated stores 75 86
Closed stores (25) (51)
Ofthe2.0millionsellingsquarefootincrease
in2009approximately0.3millionwasaddedby
expanding existing stores.
Grossprotmarginincreasedto35.5%in2009
comparedto34.3%in2008.Theincreasewasdueto
the following:
•Merchandisecosts,includinginboundfreight,
decreased80basispointsdueprimarilytolower
fuel costs and lower ocean freight rates compared
totheprioryear.Improvedinitialmark-upinmany
categories during the year was partially offset by
an increase in the mix of higher cost consumer
productmerchandiseduringscal2009compared
toscal2008.
•Outboundfreightcostsdecreased20basispoints
in the current year due primarily to decreased fuel
costs.
•Occupancyanddistributioncostsdecreased30
basis points in the current year resulting from the
leveraging of the comparable store sales increase.
Selling, General and Administrative Expenses.
Selling, general and administrative expenses, as a
percentageofnetsales,decreasedto25.7%for2009
comparedto26.4%for2008.Thedecreaseisprimarily
due to the following:
•Depreciationdecreased40basispointsprimarily
due to the leveraging associated with the increase
in comparable store net sales in the current year.
•Storeoperatingcostsdecreased30basispoints
primarily as a result of lower utility costs as a
percentage of sales, due to lower rates in the current
year and the leveraging from the comparable store
netsalesincreasein2009.
Operating Income.Duetothereasonsdiscussed
above,operatingincomemarginwas9.8%in2009
comparedto7.9%in2008.
Income Taxes.Oureffectivetaxratewas36.9%in
2009comparedto36.1%in2008.Thehigherratein
the current year was the result of the favorable settle-
mentofseveralstatetaxauditsin2008andahigher
blendedstatetaxratein2009.
Fiscal year ended January 31, 2009 compared
to fiscal year ended February 2, 2008
Net Sales.Netsalesincreased9.5%,or$402.3million,
in2008comparedto2007,resultingfromsalesin
ournewandexpandedstoresanda4.1%increasein
comparable store net sales. Comparable store net sales
are positively affected by our expanded and relocated
stores, which we include in the calculation, and, to a
lesser extent, are negatively affected when we open new
stores or expand stores near existing ones.
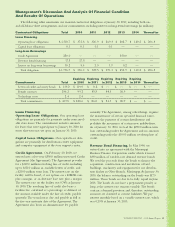
Thefollowingtablesummarizesthecomponents
ofthechangesinourstorecountforscalyearsended
January31,2009andFebruary2,2008.
January 31,
2009
February2,
2008
New stores 227 208
Acquired leases 432
Expanded or
relocated stores 86 102
Closed stores (51) (48)
Of the 1.9 million selling square foot increase
in2008approximately0.3millionwasaddedby
expanding existing stores.
DOLLARTREE,INC.•2009AnnualReport17