Dollar Tree 2009 Annual Report Download - page 3
Download and view the complete annual report
Please find page 3 of the 2009 Dollar Tree annual report below. You can navigate through the pages in the report by either clicking on the pages listed below, or by using the keyword search tool below to find specific information within the annual report.-
 1
1 -
 2
2 -
 3
3 -
 4
4 -
 5
5 -
 6
6 -
 7
7 -
 8
8 -
 9
9 -
 10
10 -
 11
11 -
 12
12 -
 13
13 -
 14
14 -
15
-
16
-
17
-
18
-
19
-
20
-
21
-
22
-
23
-
24
-
25
-
26
-
27
-
28
-
29
-
30
-
31
-
32
-
33
-
34
-
35
-
36
-
37
-
38
-
39
-
40
-
41
-
42
-
43
-
44
-
45
-
46
-
47
-
48
-
49
-
50
-
51
-
52
 |
 |
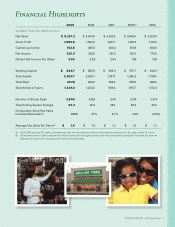
2009 2008 2007 2006(a) 2005
(in millions, except store and per share data)
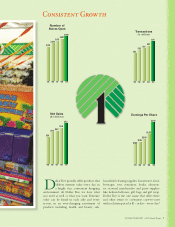
Net Sales $ 5,231.2 $ 4,644.9 $ 4,242.6 $ 3,969.4 $ 3,393.9
Gross Profit 1,856.8 1,592.2 1,461.1 1,357.2 1,172.4
Operating Income 512.8 365.8 330.3 310.8 283.9
Net Income 320.5 229.5 201.3 192.0 173.9
Diluted Net Income Per Share 3.56 2.53 2.09 1.85 1.60
Working Capital $ 829.7 $ 663.3 $ 382.9 $ 575.7 $ 648.2
Total Assets 2,289.7 2,035.7 1,787.7 1,882.2 1,798.4
Total Debt 267.8 268.2 269.4 269.5 269.9
Shareholders’ Equity 1,429.2 1,253.2 988.4 1,167.7 1,172.3
Number of Stores Open 3,806 3,591 3,411 3,219 2,914
Total Selling Square Footage 32.3 30.3 28.4 26.3 23.0
Comparable Store Net Sales
Increase/(Decrease)(b) 7.2% 4.1% 2.7% 4.6% (0.8%)
Average Net Sales Per Store(b) $ 1.4 $ 1.3 $ 1.3 $ 1.3 $ 1.2
(a) Fiscal 2006 includes 53 weeks, commensurate with the retail calendar, while all other fiscal years reported in the table contain 52 weeks.
(b) Comparable store net sales compare net sales for stores open throughout each of the two periods being compared. Net sales per store are
calculated for stores open throughout the entire period presented.
DOLLARTREE,INC.•2009AnnualReport1