Dollar Tree 2009 Annual Report Download - page 18
Download and view the complete annual report
Please find page 18 of the 2009 Dollar Tree annual report below. You can navigate through the pages in the report by either clicking on the pages listed below, or by using the keyword search tool below to find specific information within the annual report.-
 1
1 -
2
-
3
-
4
-
5
-
6
-
7
-
 8
8 -
 9
9 -
 10
10 -
 11
11 -
 12
12 -
 13
13 -
 14
14 -
 15
15 -
 16
16 -
 17
17 -
 18
18 -
 19
19 -
 20
20 -
 21
21 -
 22
22 -
 23
23 -
 24
24 -
 25
25 -
 26
26 -
 27
27 -
 28
28 -
29
-
30
-
31
-
32
-
33
-
34
-
35
-
36
-
37
-
38
-
39
-
40
-
41
-
42
-
43
-
44
-
45
-
46
-
47
-
48
-
49
-
50
-
51
-
52
 |
 |

anhourwaseffectiveinJuly2009.Asaresult,our
wageshaveincreasedinthethirdquarterof2009and
wageswillcontinuetoincreasethroughthersthalf
of2010;however,webelievethatwecanoffsetthe
increase in payroll costs through increased productivity
andcontinuedefcienciesinproductowtoourstores.
Wemustcontinuetocontrolourmerchandise
costs, inventory levels and our general and administra-
tiveexpenses.Increasesintheselineitemscould
negatively impact our operating results.
Management’s Discussion And Analysis Of Financial Condition
And Results Of Operations
buyers and improve our merchandise allocation to our
stores.Webelievethatthishasenabledustobetter
manageourinventoryowresultinginmoreefcient
distribution and store operations and increased inven-
toryturnoverforeachofthelastveyears.Inventory
turnoverimprovedbyapproximately25basispointsin
2009toover4turnsfortheyear.Inventoryperselling
squarefootalsodecreased5.6%atJanuary30,2010
comparedtoJanuary31,2009.
InMay2007,legislationwasenactedthatincreased
theFederalMinimumWage.Thelastincreaseto$7.25
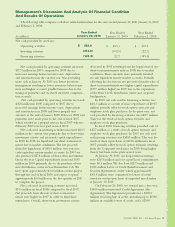
Results of Operations
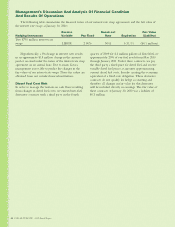
The following table expresses items from our consolidated statements of operations, as a percentage of net sales:
Year Ended
January 30,
2010
YearEnded
January31,
2009
YearEnded
February2,
2008
Net sales 100.0% 100.0% 100.0 %
Cost of sales 64.5% 65.7% 65.6%
Grossprot 35.5% 34.3% 34.4%
Selling, general and administrative expenses 25.7% 26.4% 26.6%
Operating income 9.8% 7.9 % 7.8 %
Interestincome 0.0% 0.0% 0.1%
Interestexpense (0.1%) (0.2%) (0.4%)
Incomebeforeincometaxes 9.7% 7.7 % 7.5%
Provision for income taxes (3.6%) (2.8%) (2.8%)
Net income 6.1% 4.9% 4.7%
16DOLLARTREE,INC.•2009AnnualReport