Dollar Tree 2009 Annual Report Download - page 20
Download and view the complete annual report
Please find page 20 of the 2009 Dollar Tree annual report below. You can navigate through the pages in the report by either clicking on the pages listed below, or by using the keyword search tool below to find specific information within the annual report.-
 1
1 -
2
-
3
-
4
-
5
-
6
-
7
-
8
-
9
-
 10
10 -
 11
11 -
 12
12 -
 13
13 -
 14
14 -
 15
15 -
 16
16 -
 17
17 -
 18
18 -
 19
19 -
 20
20 -
 21
21 -
 22
22 -
 23
23 -
 24
24 -
 25
25 -
 26
26 -
 27
27 -
 28
28 -
 29
29 -
 30
30 -
31
-
32
-
33
-
34
-
35
-
36
-
37
-
38
-
39
-
40
-
41
-
42
-
43
-
44
-
45
-
46
-
47
-
48
-
49
-
50
-
51
-
52
 |
 |

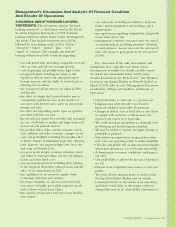
Management’s Discussion And Analysis Of Financial Condition
And Results Of Operations
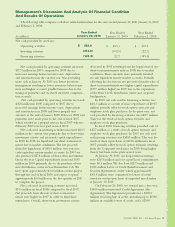
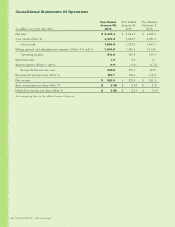
Operating Income.Duetothereasonsdiscussed
above,operatingincomemarginwas7.9%in2008
comparedto7.8%in2007.
Income Taxes.Oureffectivetaxratewas36.1%in
2008comparedto37.1%in2007.Thelowerratein
2008reectstherecognitionofcertaintaxbenets
and a lower blended state tax rate resulting from the
settlementofstatetaxauditsin2008whichallowedus
to release income tax reserves and accrue less interest
expenseontaxuncertainties.Thesebenetstothetax
rate were partially offset by a reduction in tax-exempt
interestincomein2008.
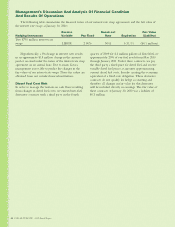
Liquidity and Capital Resources
Our business requires capital to build and open new
stores, expand our distribution network and operate
existing stores. Our working capital requirements for
existing stores are seasonal and usually reach their
peak in September and October. Historically, we have
satisedourseasonalworkingcapitalrequirements
for existing stores and have funded our store opening
and distribution network expansion programs from
internally generated funds and borrowings under our
credit facilities.
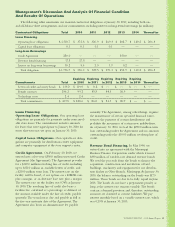
Gross Profit.Grossprotmargindecreasedto34.3%
in2008comparedto34.4%in2007.Thedecreasewas
primarilyduetoa30basispointincreaseinmerchan-
dise cost, including inbound freight, resulting from
an increase in the sales mix of higher cost consumer
product merchandise and higher diesel fuel costs
comparedwith2007.Partiallyoffsettingthisincrease
wasa20basispointdecreaseinshrinkexpensedue
tofavorableadjustmentstoshrinkestimatesbasedon
actual inventory results during the year.
Selling, General and Administrative Expenses.
Selling, general and administrative expenses, as a
percentageofnetsales,decreasedto26.4%for2008
comparedto26.6%for2007.Thedecreaseisprimarily
due to the following:
•Depreciationexpensedecreased25basispoints
primarily due to the leveraging associated with the
comparable store net sales increase for the year.
•Payroll-relatedexpensesdecreased10basispoints
primarilyasaresultoflowereldpayrollcostsasa
percentage of sales, due to the leveraging from the
comparablestorenetsalesincreasein2008.
•Partiallyoffsettingthesedecreaseswasanapproxi-
mate10basispointincreaseinstoreoperatingcosts
due to increases in repairs and maintenance and
utility costs in the current year.
18DOLLARTREE,INC.•2009AnnualReport