Carphone Warehouse 2012 Annual Report Download - page 20
Download and view the complete annual report
Please find page 20 of the 2012 Carphone Warehouse annual report below. You can navigate through the pages in the report by either clicking on the pages listed below, or by using the keyword search tool below to find specific information within the annual report.-
 1
1 -
2
-
3
-
4
-
5
-
6
-
7
-
8
-
9
-
 10
10 -
 11
11 -
 12
12 -
 13
13 -
 14
14 -
 15
15 -
 16
16 -
 17
17 -
 18
18 -
 19
19 -
 20
20 -
 21
21 -
 22
22 -
 23
23 -
 24
24 -
 25
25 -
 26
26 -
 27
27 -
 28
28 -
 29
29 -
 30
30 -
31
-
32
-
33
-
34
-
35
-
36
-
37
-
38
-
39
-
40
-
41
-
42
-
43
-
44
-
45
-
46
-
47
-
48
-
49
-
50
-
51
-
52
-
53
-
54
-
55
-
56
-
57
-
58
-
59
-
60
-
61
-
62
-
63
-
64
-
65
-
66
-
67
-
68
-
69
-
70
-
71
-
72
-
73
-
74
-
75
-
76
-
77
-
78
-
79
-
80
-
81
-
82
-
83
-
84
-
85
-
86
-
87
-
88
-
89
-
90
 |
 |

Carphone Warehouse Group plc Annual Report 201216
2012 2011
Cash flow (100% basis) £m £m
Headline EBITDA 219.6 219.1
Working capital (170.8) (35.0)
Capex (88.3) (69.4)
Operating free cash flow (39.5) 114.7
Best Buy Mobile 45.0 97.9
Best Buy UK (124.5) (78.0)
Other (42.1) (60.3)
Movement in net (debt) funds (161.1) 74.3
Opening net funds 131.7 57.4
Closing net (debt) funds (29.4) 131.7
Headline EBITDA was broadly flat year‑on‑year at £219.6m
(2011:£219.1m) forthe reasons described above.
CPW Europe experienced a working capital outflow of £170.8m
inthe year, up from £35.0m in the previous year. The largest part
ofthis increase reflected the temporary build‑up of network
receivables as a result of a sales weighting towards networks
withless favourable payment terms; these terms are being
addressed as part of the finalisation of new long‑term
contractualagreements.
The working capital absorption also reflects moving to direct
supplyarrangements on some key handsets.
Capex spend increased to £88.3m (2011: £69.4m) reflecting substantial
additional investment in the Wireless World store format and
increased investment in IT platforms. These items wereoffset
byproceeds of £16.5m from the sale ofPhone House Belgium.
Best Buy Mobile reflects CPW Europe’s profit share inthis
business, as described above.
Total cash costs associated with Best Buy UK were £124.5m,
reflecting EBITDA losses of £69.1m, capex of £4.5m and closure
costs incurred in the year of £50.9m. Further closure costs of
approximately £50m are expected in the year to March 2013,
principally in relation to final property exit costs.
Tax payments made during the year reduced to £12.7m (2011: £44.0m)
principally reflecting lower tax payments in the UK due to the closure
costs ofBest Buy UK and lower profits from Best Buy Mobile.
Exceptional cash costs of £10.4m were incurred in the year
inrelation to the Best Buy Mobile Disposal, principally in relation
tothe incentive schemes described above.
The main other components of other cash flows are interest costs
and facility fees associated with the new £400mRCF.
At the end of the year, net debt within CPW Europe was £29.4m
(2011: net funds of £131.7m) reflecting the cash flows described above.
OUTLOOK
We expect the consumer environment in Europe to remain
challenging in the year ahead along with the continued effect
ofregulation and competition in the mobile market. However,
wesee some exciting opportunities and remain confident in
ourstrategic positioning and operational execution.
The effect of reduced subsidies on the prepay market is likely
tocontinue into the coming year, and as a result we expect that
connection volumes will show a similar year‑on‑year decline in
thefirst half of the coming year as we saw in the second half of
last, causing the same pattern in like‑for‑like revenue. However,
weremain confident in our opportunity to reinvigorate the prepay
market by driving smartphone penetration into that segment, and
expect this to mitigate the structural effect of reduced subsidies,
particularly in the second half.
We expect continuing pressure on network revenues as a result
ofregulation, competition and the consumer environment, and
expect this in turn to affect CPW Europe’s revenues and margins.
Against this, the business is set to enjoy the growing benefit of
customer revenues beyond the initial contract period, through
thecommercial terms previously agreed with network operators.
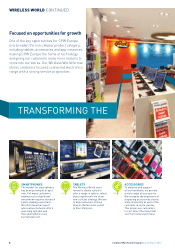
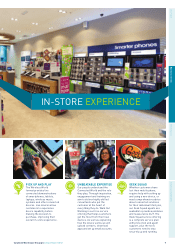
We also anticipate continued returns from our ongoing investment
in Wireless World stores, and see exciting opportunity to grow our
non‑cellular revenues, as more and more products that utilise
connected devices come to market.
Overall, we expect Headline EBIT to be in the range £130m to £150m,
with the ultimate outturn for the year likely to be dependent on our
success in driving smartphones more fully into the prepay segment,
and on broader economic conditions in some of our continental
European markets.
Cash generation will be a key priority for the business in the
coming year, and we expect a working capital inflow of over £100m,
reversing the short‑term negative pattern that we saw in the year
to March 2012.
Given the challenging environment, particularly in some of our
continental European markets, we will naturally be exploring various
cost reduction opportunities throughout CPW Europe. We will also
continue toexplore opportunities to gain further scale in a number
of our mainland European markets.
PERFORMANCE REVIEW CONTINUED
CPW EUROPE