Carphone Warehouse 2012 Annual Report Download - page 18
Download and view the complete annual report
Please find page 18 of the 2012 Carphone Warehouse annual report below. You can navigate through the pages in the report by either clicking on the pages listed below, or by using the keyword search tool below to find specific information within the annual report.-
 1
1 -
2
-
3
-
4
-
5
-
6
-
7
-
 8
8 -
 9
9 -
 10
10 -
 11
11 -
 12
12 -
 13
13 -
 14
14 -
 15
15 -
 16
16 -
 17
17 -
 18
18 -
 19
19 -
 20
20 -
 21
21 -
 22
22 -
 23
23 -
 24
24 -
 25
25 -
 26
26 -
 27
27 -
 28
28 -
29
-
30
-
31
-
32
-
33
-
34
-
35
-
36
-
37
-
38
-
39
-
40
-
41
-
42
-
43
-
44
-
45
-
46
-
47
-
48
-
49
-
50
-
51
-
52
-
53
-
54
-
55
-
56
-
57
-
58
-
59
-
60
-
61
-
62
-
63
-
64
-
65
-
66
-
67
-
68
-
69
-
70
-
71
-
72
-
73
-
74
-
75
-
76
-
77
-
78
-
79
-
80
-
81
-
82
-
83
-
84
-
85
-
86
-
87
-
88
-
89
-
90
 |
 |

Carphone Warehouse Group plc Annual Report 201214
2012 2011
Headline income statement (100% basis)*
£m £m
Revenue 3,313.1 3,504.8
Gross margin 947.4 996.0
GM % 28.6% 28.4%
Operating expenses (727.8) (776.9)
EBITDA** 219.6 219.1
Depreciation and amortisation (84.6) (84.5)
EBIT 135.0 134.6
EBIT % 4.1% 3.8%
Interest (16.4) (15.2)
Tax (22.0) (24.8)
PAT 96.6 94.6
Group share 48.3 47.3
* Headline results exclude exceptional items and discontinued businesses.
Details of these items can be found in note 4 to the Group financial statements.
** Headline EBITDA includes the unwinding of discounts for the time value
ofmoney on network commissions receivable over the life of the customer.
Thisunwind is treated as interest income in the joint venture’s statutory results.
Further details can be found in note13 to the Group financial statements.
CPW Europe generated revenues of £3,313.1m, a decrease of 5.5%
year‑on‑year (2011: £3,504.8m). As anticipated, revenues associated
with our German service provider business fell by around £100m,
as we concluded its migration to a more typical retail model.
CPW Europe saw a like‑for‑like revenue decline of 4.6%, reflecting
structural changes in certain European markets.
The first half ofthe year saw the impact of the shift from 18 month
to24 month contracts in the UK from mid‑2009 onwards which
reduced the number of upgrades available in the market. The effect
ofthis shift annualised during the year and the UK business showed
growth inpostpay connections in the second half of theyear.
Regulatory cuts to mobile termination rates in the first half of
theyear resulted in network operators reducing subsidies on
prepay handsets, causing a drop of 30–40% in prepay connection
volumes in some markets. While the impact of this was principally
seen on relatively low value connections, which had a limited effect
on profitability, therevenue lost from these transactions had an
adverse impact on like‑for‑like revenue, particularly in the second
half of the year.
Smartphone penetration continued to increase in the postpay
segment, driving an improvement in average revenue per connection.
The prepay segment was subdued by the reduction of subsidies noted
above, together with weak consumer confidence, and smartphone
penetration in this category has remained relatively low to date.
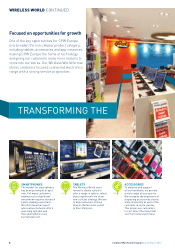
Reduced prepay revenues were partially offset by increased
non‑cellular revenues, where we saw year‑on‑year growth of over
15% in the second half of the year. Non‑cellular is still a very small
part of overall revenue, but the potential for growth presented by
tablets, accessories and app‑cessories is significant.
The consumer environment continues to be challenging in
someofour mainland European markets. We are therefore
focusing onscale, structure and strong cost control to help
mitigatethesechallenges.
In December 2011, CPW Europe completed the disposal of its retail
operations inBelgium to Belgacom for net cash consideration
of£16.5m. CPW Europe recorded a gain of £8.0m on the disposal,
although this was substantially offset by the adverse trading impact
of having announced the sale to Belgacom in April 2011.
Connection volumes (excluding Belgium and Best Buy UK) dropped
year‑on‑year, falling by 13.9% from 11.4m to 9.8m, reflecting the
factors noted above.
CPW Europe opened or resited 195 stores, closed 149 and disposed
of 82 in Belgium, ending the year at 2,393 stores, slightly lower than
the 2,429 at the start of the year. Within this portfolio, the number
of franchise stores increased from 243 at March 2011 to 338 at the
end of the year, primarily reflecting growth in France and Spain.
Inaddition to the disposal in Belgium, the decrease in own stores
reflects the closure of further stores in Germany, along with some
smaller stores in other territories.
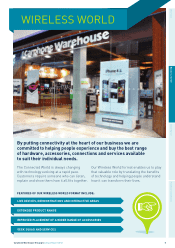
The business has continued to develop its Wireless World store format.
At the start of the year we targeted having 350–400 of these stores
by the end of March 2012. We ended the year towards the top end
ofthis range with 392 Wireless World stores across our eight
remaining retail markets. We continue to see the benefits of this
store format both in our financial results and in our customer
service scores and remain committed to converting further stores
in the year ahead.
The gross margin percentage increased by 20 basis points
year‑on‑year to 28.6% (2011: 28.4%).
The shift from 18 to 24 month contracts in the UK caused a drop
inhigh margin postpay connections in the first half of the year.
Additionally, the business saw the effect of pressure on network
ARPUs, due to regulation, competition and the challenging consumer
environment, affecting both revenues and margins particularly
inthesecond half of the year.
The business maintained EBIT year-on-year at £135m despite
market challenges and a tough economicenvironment.
PERFORMANCE REVIEW
CPW EUROPE