Canon 2011 Annual Report Download - page 2
Download and view the complete annual report
Please find page 2 of the 2011 Canon annual report below. You can navigate through the pages in the report by either clicking on the pages listed below, or by using the keyword search tool below to find specific information within the annual report.-
 1
1 -
 2
2 -
 3
3 -
 4
4 -
 5
5 -
 6
6 -
 7
7 -
 8
8 -
 9
9 -
 10
10 -
 11
11 -
 12
12 -
 13
13 -
14
-
15
-
16
-
17
-
18
-
19
-
20
-
21
-
22
-
23
-
24
-
25
-
26
-
27
-
28
-
29
-
30
-
31
-
32
-
33
-
34
-
35
-
36
-
37
-
38
-
39
-
40
-
41
-
42
-
43
-
44
-
45
-
46
-
47
-
48
-
49
-
50
-
51
-
52
-
53
-
54
-
55
-
56
-
57
-
58
-
59
-
60
-
61
-
62
-
63
-
64
-
65
-
66
-
67
-
68
-
69
-
70
-
71
-
72
-
73
-
74
-
75
-
76
-
77
-
78
-
79
-
80
-
81
-
82
-
83
-
84
-
85
-
86
-
87
-
88
-
89
-
90
-
91
-
92
-
93
-
94
-
95
-
96
-
97
-
98
-
99
-
100
-
101
-
102
-
103
-
104
 |
 |

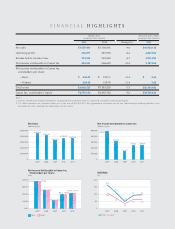
5,000,000
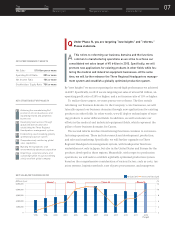
Net Sales
(Millions of yen)
4,000,000
3,000,000
2,000,000
1,000,000
0
2007 2008 2009 2010 2011
4,481,346 4,094,161
3,209,201
3,706,901 3,557,433
500,000
Net Income Attributable to Canon Inc.
(Millions of yen)
400,000
300,000
200,000
100,000
0
2007 2008 2009 2010 2011
488,332
309,148
131,647
246,603 248,630
400.00
Net Income Attributable to Canon Inc.
Stockholders per Share
(Yen)
300.00
200.00
100.00
0.00
2007 2008 2009 2010 2011
377.59
246.21
106.64
199.71
377.53
246.20
106.64
199.70
204.49 204.48
20.0
ROE/ROA
(%)
15.0
10.0
5.0
0
2007 2008 2009 2010 2011
16.5
10.8
11.1
4.9
9.2
7.3
3.4
6.3
9.6
6.3
Basic Diluted ROE ROA
FINANCIAL HIGHLIGHTS
Net sales
Operating profit
Income before income taxes
Net income attributable to Canon Inc.
Net income attributable to Canon Inc.
stockholders per share:
ȄBasic
ȄDiluted
Total assets
Canon Inc. stockholdersǯequity
¥3,557,433
378,071
374,524
248,630
¥204.49
204.48
¥3,930,727
¥2,551,132
¥3,706,901
387,552
392,863
246,603
¥199.71
199.70
¥3,983,820
¥2,645,782
-4.0
-2.4
-4.7
+0.8
+2.4
+2.4
-1.3
-3.6
$45,608,115
4,847,064
4,801,590
3,187,564
$ 2.62
2.62
$50,393,936
$32,706,821
2011
Millions of yen
(except per share amounts)
2010 Change (%) 2011
Thousands of U.S. dollars
(except per share amounts)
Notes:
1. Canonǯs consolidated financial statements are prepared in accordance with U.S. generally accepted accounting principles.
2. U.S. dollar amounts are translated from yen at the rate of JPY78=U.S.$1, the approximate exchange rate on the Tokyo Foreign Exchange Market as of
December 30, 2011, solely for the convenience of the reader.