BT 2010 Annual Report Download - page 9
Download and view the complete annual report
Please find page 9 of the 2010 BT annual report below. You can navigate through the pages in the report by either clicking on the pages listed below, or by using the keyword search tool below to find specific information within the annual report.-
 1
1 -
 2
2 -
 3
3 -
 4
4 -
 5
5 -
 6
6 -
 7
7 -
 8
8 -
 9
9 -
 10
10 -
 11
11 -
 12
12 -
 13
13 -
 14
14 -
 15
15 -
 16
16 -
 17
17 -
 18
18 -
 19
19 -
 20
20 -
21
-
22
-
23
-
24
-
25
-
26
-
27
-
28
-
29
-
30
-
31
-
32
-
33
-
34
-
35
-
36
-
37
-
38
-
39
-
40
-
41
-
42
-
43
-
44
-
45
-
46
-
47
-
48
-
49
-
50
-
51
-
52
-
53
-
54
-
55
-
56
-
57
-
58
-
59
-
60
-
61
-
62
-
63
-
64
-
65
-
66
-
67
-
68
-
69
-
70
-
71
-
72
-
73
-
74
-
75
-
76
-
77
-
78
-
79
-
80
-
81
-
82
-
83
-
84
-
85
-
86
-
87
-
88
-
89
-
90
-
91
-
92
-
93
-
94
-
95
-
96
-
97
-
98
-
99
-
100
-
101
-
102
-
103
-
104
-
105
-
106
-
107
-
108
-
109
-
110
-
111
-
112
-
113
-
114
-
115
-
116
-
117
-
118
-
119
-
120
-
121
-
122
-
123
-
124
-
125
-
126
-
127
-
128
-
129
-
130
-
131
-
132
-
133
-
134
-
135
-
136
-
137
-
138
-
139
-
140
-
141
-
142
-
143
-
144
-
145
-
146
-
147
-
148
-
149
-
150
-
151
-
152
-
153
-
154
-
155
-
156
-
157
-
158
-
159
-
160
-
161
-
162
-
163
-
164
-
165
-
166
-
167
-
168
-
169
-
170
-
171
-
172
-
173
-
174
-
175
-
176
-
177
-
178
-
179
-
180
 |
 |

OVERVIEW OUR BUSINESS
7BT GROUP PLC ANNUAL REPORT & FORM 20-F
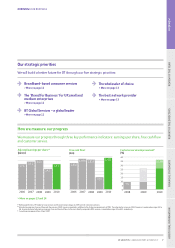
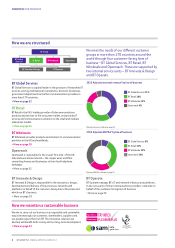
How we measure our progress
We measure our progress through three key performance indicators: earnings per share, free cash flow
and customer service.
Our strategic priorities
We will build a better future for BT through our five strategic priorities:
BT Global Services – a global leader
> More on page 12
Broadband-based consumer services
> More on page 12
The wholesaler of choice
> More on page 13
The ‘Brand for Business’ for UK small and
medium enterprises
> More on page 12
The best network provider
> More on page 13
aBefore specific items, BT Global Services contract and financial review charges in 2009 and net interest on pensions.
bAdjusted earnings per share and free cash flow are non-GAAP measures provided in addition to the disclosure requirements of IFRS. The rationale for using non-GAAP measures is explained on pages 54 to
56. A reconciliation of adjusted earnings per share and free cash flow, to the most directly comparable IFRS measure, is provided on pages 42 and 51, respectively.
cCumulative improvement from 1 April 2007.
OVERVIEWREVIEW OF THE YEARREPORT OF THE DIRECTORSFINANCIAL STATEMENTSADDITIONAL INFORMATION
20072006 2008 2009 2010
Adjusted earnings per sharea,b
(pence)
17.4 19.1 20.2
14.1
17.3
20072006 2008 2009 2010
Free cash flowb
(£m)
1,612
1,874 1,823
737
1,933
2008 2009 2010
Customer service improvementc
(%)
0
5
10
15
20
25
30
35
40
9%
17%
10.5%
> More on pages 13 and 14