BT 2010 Annual Report Download - page 5
Download and view the complete annual report
Please find page 5 of the 2010 BT annual report below. You can navigate through the pages in the report by either clicking on the pages listed below, or by using the keyword search tool below to find specific information within the annual report.-
 1
1 -
 2
2 -
 3
3 -
 4
4 -
 5
5 -
 6
6 -
 7
7 -
 8
8 -
 9
9 -
 10
10 -
 11
11 -
 12
12 -
 13
13 -
 14
14 -
 15
15 -
 16
16 -
17
-
18
-
19
-
20
-
21
-
22
-
23
-
24
-
25
-
26
-
27
-
28
-
29
-
30
-
31
-
32
-
33
-
34
-
35
-
36
-
37
-
38
-
39
-
40
-
41
-
42
-
43
-
44
-
45
-
46
-
47
-
48
-
49
-
50
-
51
-
52
-
53
-
54
-
55
-
56
-
57
-
58
-
59
-
60
-
61
-
62
-
63
-
64
-
65
-
66
-
67
-
68
-
69
-
70
-
71
-
72
-
73
-
74
-
75
-
76
-
77
-
78
-
79
-
80
-
81
-
82
-
83
-
84
-
85
-
86
-
87
-
88
-
89
-
90
-
91
-
92
-
93
-
94
-
95
-
96
-
97
-
98
-
99
-
100
-
101
-
102
-
103
-
104
-
105
-
106
-
107
-
108
-
109
-
110
-
111
-
112
-
113
-
114
-
115
-
116
-
117
-
118
-
119
-
120
-
121
-
122
-
123
-
124
-
125
-
126
-
127
-
128
-
129
-
130
-
131
-
132
-
133
-
134
-
135
-
136
-
137
-
138
-
139
-
140
-
141
-
142
-
143
-
144
-
145
-
146
-
147
-
148
-
149
-
150
-
151
-
152
-
153
-
154
-
155
-
156
-
157
-
158
-
159
-
160
-
161
-
162
-
163
-
164
-
165
-
166
-
167
-
168
-
169
-
170
-
171
-
172
-
173
-
174
-
175
-
176
-
177
-
178
-
179
-
180
 |
 |

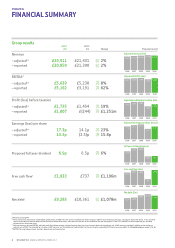
OVERVIEW FINANCIAL SUMMARY
3BT GROUP PLC ANNUAL REPORT & FORM 20-F
ADDITIONAL INFORMATION FINANCIAL STATEMENTS REPORT OF THE DIRECTORS REVIEW OF THE YEAR OVERVIEW
aUnderlying operating costs and capital expenditure, before specific items, leaver costs, depreciation and amortisation and other operating income, excluding BT Global Services contract and financial review
charges in 2009.
bBefore specific items.
cBefore pension deficit payment of £525m but after the cash costs of the BT Global Services restructuring.
dNet debt is defined on page 56.
eUnderlying operating costs before specific items and depreciation and amortisation.
fBefore pension deficit payment and before specific items of around £150m, with capital expenditure at around £2.6bn.
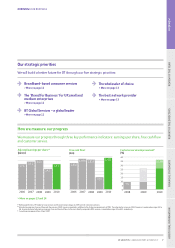
Key points for 2010
Full year results ahead of our outlook
Revenue down 2%
Total underlying costsareduced by £1,752m, down 9%
Capital expenditure reduced by £555m to £2,533m
Free cash flowcof £1,933m, an improvement of £1,196m
Net debtdreduced by over £1bn
Proposed final dividend of 4.6p per share, giving 6.9p for the full year
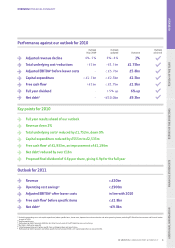
Outlook for 2011
Revenue c.£20bn
Operating cost savingsec.£900m
Adjusted EBITDAbafter leaver costs in line with 2010
Free cash flowfbefore specific items c.£1.8bn
Net debtd<£9.0bn
Performance against our outlook for 2010
Adjusted revenue decline 2%
Total underlying costareductions £1.75bn
Adjusted EBITDAbbefore leaver costs £5.8bn
Capital expenditure £2.5bn
Free cash flowc£1.9bn
Full year dividend 6% up
Net debtd£9.3bn
Outlook Outlook Outlook
May 2009 updated Outcome achieved