BT 2010 Annual Report Download - page 16
Download and view the complete annual report
Please find page 16 of the 2010 BT annual report below. You can navigate through the pages in the report by either clicking on the pages listed below, or by using the keyword search tool below to find specific information within the annual report.-
 1
1 -
2
-
3
-
4
-
5
-
 6
6 -
 7
7 -
 8
8 -
 9
9 -
 10
10 -
 11
11 -
 12
12 -
 13
13 -
 14
14 -
 15
15 -
 16
16 -
 17
17 -
 18
18 -
 19
19 -
 20
20 -
 21
21 -
 22
22 -
 23
23 -
 24
24 -
 25
25 -
 26
26 -
27
-
28
-
29
-
30
-
31
-
32
-
33
-
34
-
35
-
36
-
37
-
38
-
39
-
40
-
41
-
42
-
43
-
44
-
45
-
46
-
47
-
48
-
49
-
50
-
51
-
52
-
53
-
54
-
55
-
56
-
57
-
58
-
59
-
60
-
61
-
62
-
63
-
64
-
65
-
66
-
67
-
68
-
69
-
70
-
71
-
72
-
73
-
74
-
75
-
76
-
77
-
78
-
79
-
80
-
81
-
82
-
83
-
84
-
85
-
86
-
87
-
88
-
89
-
90
-
91
-
92
-
93
-
94
-
95
-
96
-
97
-
98
-
99
-
100
-
101
-
102
-
103
-
104
-
105
-
106
-
107
-
108
-
109
-
110
-
111
-
112
-
113
-
114
-
115
-
116
-
117
-
118
-
119
-
120
-
121
-
122
-
123
-
124
-
125
-
126
-
127
-
128
-
129
-
130
-
131
-
132
-
133
-
134
-
135
-
136
-
137
-
138
-
139
-
140
-
141
-
142
-
143
-
144
-
145
-
146
-
147
-
148
-
149
-
150
-
151
-
152
-
153
-
154
-
155
-
156
-
157
-
158
-
159
-
160
-
161
-
162
-
163
-
164
-
165
-
166
-
167
-
168
-
169
-
170
-
171
-
172
-
173
-
174
-
175
-
176
-
177
-
178
-
179
-
180
 |
 |

REVIEW OF THE YEAR OUR BUSINESS AND STRATEGY
14 BT GROUP PLC ANNUAL REPORT & FORM 20-F
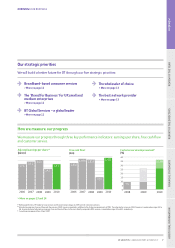
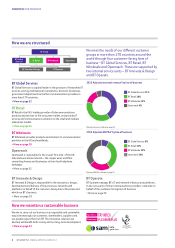
Customer service
In 2010 we achieved a 10.5% increase in the internal scores we use
to measure customer service. This compares with a 9%
improvement in 2008 and 17% in 2009. These measures are
cumulative, so the results show real progress is being made.
2010 outlook
In our original outlook statement for 2010 we said we expected:
revenue to decline by 4%-5%
a net reduction in group capital expenditure and operating costs
of well over £1bn
a reduction in group capital expenditure to around £2.7bn
group free cash flow, before any pension deficit payments, but
after the cash costs of BT Global Services restructuring, to reach
over £1bn.
During the year, as a result of our progress, we were able to update
our outlook to:
revenue to decline by 3%-4%
total underlying cost reductions of at least £1.5bn
EBITDA of around £5.7bn
capital expenditure of around £2.5bn
free cash flow of around £1.7bn
net debt below £10bn
dividend growth of around 5%.
As shown in the Financial summary on page 3 we have delivered
full year results ahead of our outlook.
2011 outlook and future plans
We aim to drive shareholder value by making BT a better business
by focusing on three areas: customer service delivery; cost
transformation; and investing for the future. We will build a better
business for the future by focusing on five strategic priorities:
driving broadband-based consumer services; being the ‘Brand for
Business’ for UK SMEs; developing BT Global Services’ position as a
global leader in networked IT services; being the wholesaler of
choice; and being the best network provider.
As part of our plans for the future, we are making an additional
investment of around £200m within our adjusted EBITDA outlook
for 2011: mainly in the areas of enhancing our TV offering;
introducing other new consumer propositions; fibre roll out; and
Customer service year-on-year improvement
(%)
2008 2009 2010
0
5
10
15
20
25
30
35
40
9%
17%
10.5%
building on opportunities in BT Global Services, particularly in the
Asia Pacific region.
If investment conditions are favourable, we see the potential to
extend our current fibre roll out to around two-thirds of UK
premises by 2015 for an incremental cost of around £1bn, while
maintaining our annual capital expenditure levels at around
£2.6bn.
For 2011 our outlook is:
revenue of around £20bn
operating cost savingsaof around £900m
adjusted EBITDAbafter leaver costs in line with last year’s level
with underlying improvement being offset by the increase in the
pension service charge of around £100m and targeted
investment in the business of around £200m
free cash flowcof around £1.8bn before the cash effect of
specific items of around £150m, with capital expenditure at
around £2.6bn
BT Global Services operating cash flow expected to show further
significant improvement, turning positive by 2012
Net debt below £9bn.
Our future outlook is as follows:
we expect improving underlying revenue trends from 2011 to
2013, with growth in 2013
BT Global Services revenue expected to grow by 2013
BT Retail expected to show an improvement in revenue trends
over the period to 2013
BT Wholesale and Openreach revenue expected to be broadly
level over the period to 2013
adjusted EBITDAbafter leaver costs expected to grow from 2011
to 2013 driven by a combination of further cost reductions and
improving revenue trends
free cash flowcbefore specific items expected to reach around
£2bn by 2013
progressive dividends over the next three years.
aUnderlying operating costs before specific items, depreciation and amortisation.
bBefore specific items.
cBefore pension deficit payment.