BT 2010 Annual Report Download - page 15
Download and view the complete annual report
Please find page 15 of the 2010 BT annual report below. You can navigate through the pages in the report by either clicking on the pages listed below, or by using the keyword search tool below to find specific information within the annual report.-
 1
1 -
2
-
3
-
4
-
 5
5 -
 6
6 -
 7
7 -
 8
8 -
 9
9 -
 10
10 -
 11
11 -
 12
12 -
 13
13 -
 14
14 -
 15
15 -
 16
16 -
 17
17 -
 18
18 -
 19
19 -
 20
20 -
 21
21 -
 22
22 -
 23
23 -
 24
24 -
 25
25 -
26
-
27
-
28
-
29
-
30
-
31
-
32
-
33
-
34
-
35
-
36
-
37
-
38
-
39
-
40
-
41
-
42
-
43
-
44
-
45
-
46
-
47
-
48
-
49
-
50
-
51
-
52
-
53
-
54
-
55
-
56
-
57
-
58
-
59
-
60
-
61
-
62
-
63
-
64
-
65
-
66
-
67
-
68
-
69
-
70
-
71
-
72
-
73
-
74
-
75
-
76
-
77
-
78
-
79
-
80
-
81
-
82
-
83
-
84
-
85
-
86
-
87
-
88
-
89
-
90
-
91
-
92
-
93
-
94
-
95
-
96
-
97
-
98
-
99
-
100
-
101
-
102
-
103
-
104
-
105
-
106
-
107
-
108
-
109
-
110
-
111
-
112
-
113
-
114
-
115
-
116
-
117
-
118
-
119
-
120
-
121
-
122
-
123
-
124
-
125
-
126
-
127
-
128
-
129
-
130
-
131
-
132
-
133
-
134
-
135
-
136
-
137
-
138
-
139
-
140
-
141
-
142
-
143
-
144
-
145
-
146
-
147
-
148
-
149
-
150
-
151
-
152
-
153
-
154
-
155
-
156
-
157
-
158
-
159
-
160
-
161
-
162
-
163
-
164
-
165
-
166
-
167
-
168
-
169
-
170
-
171
-
172
-
173
-
174
-
175
-
176
-
177
-
178
-
179
-
180
 |
 |

REVIEW OF THE YEAR OUR BUSINESS AND STRATEGY
13BT GROUP PLC ANNUAL REPORT & FORM 20-F
ADDITIONAL INFORMATION FINANCIAL STATEMENTS REPORT OF THE DIRECTORS REVIEW OF THE YEAR OVERVIEW
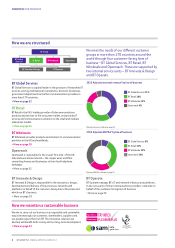
conclude that previous estimates of profitability for some of our
major contracts were no longer likely to be achieved.
The Board took action as a result of these issues and BT Global
Services has been restructured including changes being made to
the senior management team (see BT Global Services – How BT
Global Services is changing on page 22).
Over the past year we have worked to improve efficiency and
delivery, and to build a stronger business. We have made significant
progress. We have improved the way we bid for and manage
contracts, reduced costs and delivered better service for customers.
These changes are delivering results with an improved financial and
operational performance, and this is already showing in BT Global
Services’ financial results, with a sequential improvement in
adjusted EBITDA and a £430m reduction in operating cash outflow
in 2010. But there is still much more to do and we will continue to
drive this transformation.
We are seeking to strengthen our market position by enhancing
our product portfolio and improving customer service and contract
delivery, as well as through targeted investment in areas of
potential profitable growth, such as in the Asia Pacific region where
we already have a strong market presence. In this way, we can build
on BT Global Services’ world-leading position.
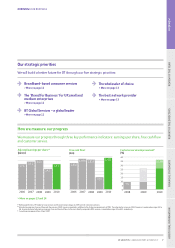
The wholesaler of choice
BT is committed to supplying CPs in the UK and overseas with vital
communications infrastructure. We have the broadest portfolio in
the industry and are trusted to underpin the UK’s infrastructure. We
aim to be the wholesaler of choice in the UK, where we have more
than 1,000 CP customers and we are the established leader for
carriers, and to extend and develop our international wholesale
business. Over the next year, we also aim to consolidate further our
position as a leading provider of managed network services (MNS)
in the UK’s fixed and mobile markets.
Our traditional wholesale markets are in decline, but we expect
to see the addressable market grow in the medium term due to
growth in digital content, consolidation, convergence and capital
constraints which make our white label services attractive for
operators who do not want to invest in a fixed line infrastructure.
We believe the capacity demand on our networks will quadruple by
2013.
We are simplifying and reinventing our portfolio through internet
protocol (IP), enhancing our capabilities and expanding our
addressable market to become a next generation wholesale
business. We are investing in our products and services for the
future, developing advanced, software-driven platforms and
services that, for example, exchange traditional and IP traffic and
capabilities to deliver video content which is growing exponentially.
In the mobile space, we are facilitating mobile network
operators’ entry into the fixed line market and have MNS contracts
in place with all five key operators. We are enabling the growth of
3G mobile data volumes in a market that is consolidating through
mergers and infrastructure joint ventures.
The best network provider
Super-fast fibre-based broadband is critical to BT’s future success
and will be critical to the UK economy. We will play a major part in
this new communications environment and are making good
progress in deploying this new technology.
At the same time, we will also continue to focus on our market-
leading Ethernet footprint – which expanded from 600 nodes, or
access points for customers, in 2009 to more than 800 in 2010.
Being the best network provider is not just about expanding
coverage. We have also improved reliability and reduced costs
through our cost saving and efficiency programmes. Our plan is to
continue to deliver operational savings through further focus on
the efficiency of our work. We have reduced the number of IT
incidents across the network by 33% over the last two years.
How we measure our progress
We measure our progress through three key performance
indicators: earnings per share, free cash flow and customer service.
Adjusted earnings per share
Adjusted earnings per share was 17.3p in 2010, compared with
14.1p in 2009 and 20.2p in 2008 (see Financial review page 47).
Free cash flow
Free cash flow in 2010 was £1,933m, compared with £737m in
2009 and £1,823m in 2008 (see Financial review page 51).
aBefore specific items, BT Global Services contract and financial review charges in 2009 and net
interest on pensions.
bAdjusted basic earnings per share and free cash flow are non-GAAP measures provided in addition
to the disclosure requirements of IFRS. The rationale for using non-GAAP measures is explained on
pages 54 to 56. A reconciliation of adjusted earnings per share and free cash flow, to the most
directly comparable IFRS measure, is provided on pages 42 and 51, respectively.
Free cash flowb
(£m)
2006 2007 2008 2009 2010
1,612
1,874 1,823
737
1,933
Adjusted earnings per sharea,b
(pence)
2006 2007 2008 2009 2010
17.4 19.1 20.2
14.1
17.3