BT 2010 Annual Report Download - page 4
Download and view the complete annual report
Please find page 4 of the 2010 BT annual report below. You can navigate through the pages in the report by either clicking on the pages listed below, or by using the keyword search tool below to find specific information within the annual report.-
 1
1 -
 2
2 -
 3
3 -
 4
4 -
 5
5 -
 6
6 -
 7
7 -
 8
8 -
 9
9 -
 10
10 -
 11
11 -
 12
12 -
 13
13 -
 14
14 -
 15
15 -
16
-
17
-
18
-
19
-
20
-
21
-
22
-
23
-
24
-
25
-
26
-
27
-
28
-
29
-
30
-
31
-
32
-
33
-
34
-
35
-
36
-
37
-
38
-
39
-
40
-
41
-
42
-
43
-
44
-
45
-
46
-
47
-
48
-
49
-
50
-
51
-
52
-
53
-
54
-
55
-
56
-
57
-
58
-
59
-
60
-
61
-
62
-
63
-
64
-
65
-
66
-
67
-
68
-
69
-
70
-
71
-
72
-
73
-
74
-
75
-
76
-
77
-
78
-
79
-
80
-
81
-
82
-
83
-
84
-
85
-
86
-
87
-
88
-
89
-
90
-
91
-
92
-
93
-
94
-
95
-
96
-
97
-
98
-
99
-
100
-
101
-
102
-
103
-
104
-
105
-
106
-
107
-
108
-
109
-
110
-
111
-
112
-
113
-
114
-
115
-
116
-
117
-
118
-
119
-
120
-
121
-
122
-
123
-
124
-
125
-
126
-
127
-
128
-
129
-
130
-
131
-
132
-
133
-
134
-
135
-
136
-
137
-
138
-
139
-
140
-
141
-
142
-
143
-
144
-
145
-
146
-
147
-
148
-
149
-
150
-
151
-
152
-
153
-
154
-
155
-
156
-
157
-
158
-
159
-
160
-
161
-
162
-
163
-
164
-
165
-
166
-
167
-
168
-
169
-
170
-
171
-
172
-
173
-
174
-
175
-
176
-
177
-
178
-
179
-
180
 |
 |

OVERVIEW
2BT GROUP PLC ANNUAL REPORT & FORM 20-F
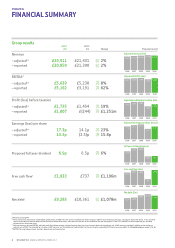
FINANCIAL SUMMARY
Group results
2010 2009a
£m £m Change Five year record
Revenue
– adjustedb,c £20,911 £21,431 2%
– reported £20,859 £21,390 2%
Proposed full year dividend 6.9p 6.5p 6%
aRestated. See page 94.
bItems presented as adjusted are stated before specific items, BT Global Services contract and financial review charges in 2009 and net interest on pensions. See page 55 for further details. In our quarterly
results announcements we also report adjusted measures before leaver costs, consistent with the basis of our outlook for the year (see page 3). From 2011 onwards, we will be reporting our quarterly
adjusted results after leaver costs.
cAdjusted revenue, adjusted EBITDA, adjusted profit (loss) before taxation, adjusted earnings (loss) per share, free cash flow and net debt are non-GAAP measures provided in addition to the disclosure
requirements of IFRS. The rationale for using non-GAAP measures and the locations of reconciliations to the most directly comparable IFRS measure are provided in the Financial review on pages 54 to 56.
dEBITDA: Earnings before interest, taxation, depreciation and amortisation.
Earnings (loss) per share
– adjustedb,c 17.3p 14.1p 23%
– reported 13.3p (2.5)p 15.8p
Profit (loss) before taxation
– adjustedb,c £1,735 £1,454 19%
– reported £1,007 £(244) £1,251m
EBITDAd
– adjustedb,c £5,639 £5,238 8%
– reported £5,162 £3,191 62%
2009 201020082006 2007
21,431 20,911
20,704
19,514 20,223
Adjusted revenue (£m)
2009 201020082006 2007
5,238 5,639
5,784
5,517 5,633
Adjusted EBITDA (£m)
2009 201020082006 2007
1,454
1,735
2,086
1,923 2,075
Adjusted profit before taxation (£m)
2009 201020082006 2007
14.1
17.3
20.2
17.4 19.1
Adjusted earnings per share (pence)
2009 201020082006 2007
6.50 6.90
15.80
11.90
15.10
Full year dividend (pence)
Free cash flowc£1,933 £737 £1,196m
2009 201020082006 2007
737
1,933
1,823
1,612 1,874
Free cash flow (£m)
Net debtc£9,283 £10,361 £1,078m
2009 201020082006 2007
10,361 9,283
9,460
7,534 7,914
Net debt (£m)