Airtran 2008 Annual Report Download - page 72
Download and view the complete annual report
Please find page 72 of the 2008 Airtran annual report below. You can navigate through the pages in the report by either clicking on the pages listed below, or by using the keyword search tool below to find specific information within the annual report.-
 1
1 -
2
-
3
-
4
-
5
-
6
-
7
-
8
-
9
-
10
-
11
-
12
-
13
-
14
-
15
-
16
-
17
-
18
-
19
-
20
-
21
-
22
-
23
-
24
-
25
-
26
-
27
-
28
-
29
-
30
-
31
-
32
-
33
-
34
-
35
-
36
-
37
-
38
-
39
-
40
-
41
-
42
-
43
-
44
-
45
-
46
-
47
-
48
-
49
-
50
-
51
-
52
-
53
-
54
-
55
-
56
-
57
-
58
-
59
-
60
-
61
-
 62
62 -
 63
63 -
 64
64 -
 65
65 -
 66
66 -
 67
67 -
 68
68 -
 69
69 -
 70
70 -
 71
71 -
 72
72 -
 73
73 -
 74
74 -
 75
75 -
 76
76 -
 77
77 -
 78
78 -
 79
79 -
 80
80 -
 81
81 -
 82
82 -
83
-
84
-
85
-
86
-
87
-
88
-
89
-
90
-
91
-
92
-
93
-
94
-
95
-
96
-
97
-
98
-
99
-
100
-
101
-
102
-
103
-
104
-
105
-
106
-
107
-
108
-
109
-
110
-
111
-
112
-
113
-
114
-
115
-
116
-
117
-
118
-
119
-
120
-
121
-
122
-
123
-
124
 |
 |

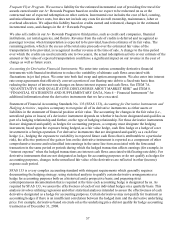
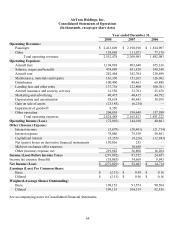
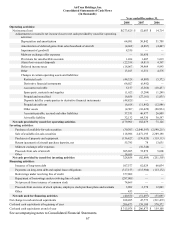
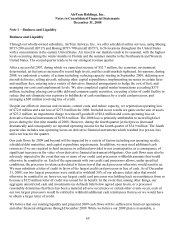
AirTran Holdings, Inc.
Consolidated Statements of Operations
(In thousands, except per share data)
Year ended December 31,
2008 2007 2006
Operating Revenues:
Passenger $ 2,413,609 $ 2,198,910 $ 1,814,907
Other 138,869 111,073 77,176
Total operating revenues 2,552,478 2,309,983 1,892,083
Operating Expenses:
Aircraft fuel 1,194,938 803,640 675,336
Salaries, wages and benefits 474,889 451,818 390,348
Aircraft rent 242,464 242,764 230,699
Maintenance, materials and repairs 163,350 151,265 126,062
Distribution 100,400 88,461 69,888
Landing fees and other rents 137,738 122,800 100,761
Aircraft insurance and security services 21,556 23,761 25,678
Marketing and advertising 40,475 40,415 44,792
Depreciation and amortization 58,618 48,485 30,078
Gain on sale of assets (23,185) (6,234)
—
Impairment of goodwill 8,350
—
—
Other operating 204,895 198,648 157,580
Total operating expenses 2,624,488 2,165,823 1,851,222
Operating Income (Loss) (72,010) 144,160 40,861
Other (Income) Expense:
Interest income (3,679) (20,401) (21,714)
Interest expense 78,080 75,530 50,861
Capitalized interest (5,355) (9,226) (12,943)
Net (gains) losses on derivative financial instruments 150,836 255
—
Midwest exchange offer expenses
—
10,650
—
Other (income) expense, net 219,882 56,808 16,204
Income (Loss) Before Income Taxes (291,892) 87,352 24,657
Income tax expense (benefit) (18,063) 34,669 9,943
Net Income (Loss) $ (273,829) $ 52,683 $ 14,714
Earnin
g
s
(
Loss
)
Per Common Share:
Basic $ (2.51) $ 0.58 $ 0.16
Diluted $ (2.51) $ 0.56 $ 0.16
Weighted-Average Shares Outstanding:
Basic 109,153 91,574 90,504
Diluted 109,153 104,319 92,436
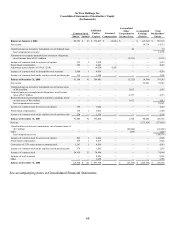
See accompanying notes to Consolidated Financial Statements.
64