Airtran 2008 Annual Report Download - page 52
Download and view the complete annual report
Please find page 52 of the 2008 Airtran annual report below. You can navigate through the pages in the report by either clicking on the pages listed below, or by using the keyword search tool below to find specific information within the annual report.-
 1
1 -
2
-
3
-
4
-
5
-
6
-
7
-
8
-
9
-
10
-
11
-
12
-
13
-
14
-
15
-
16
-
17
-
18
-
19
-
20
-
21
-
22
-
23
-
24
-
25
-
26
-
27
-
28
-
29
-
30
-
31
-
32
-
33
-
34
-
35
-
36
-
37
-
38
-
39
-
40
-
41
-
 42
42 -
 43
43 -
 44
44 -
 45
45 -
 46
46 -
 47
47 -
 48
48 -
 49
49 -
 50
50 -
 51
51 -
 52
52 -
 53
53 -
 54
54 -
 55
55 -
 56
56 -
 57
57 -
 58
58 -
 59
59 -
 60
60 -
 61
61 -
 62
62 -
63
-
64
-
65
-
66
-
67
-
68
-
69
-
70
-
71
-
72
-
73
-
74
-
75
-
76
-
77
-
78
-
79
-
80
-
81
-
82
-
83
-
84
-
85
-
86
-
87
-
88
-
89
-
90
-
91
-
92
-
93
-
94
-
95
-
96
-
97
-
98
-
99
-
100
-
101
-
102
-
103
-
104
-
105
-
106
-
107
-
108
-
109
-
110
-
111
-
112
-
113
-
114
-
115
-
116
-
117
-
118
-
119
-
120
-
121
-
122
-
123
-
124
 |
 |
Regardless of the financial accounting for income taxes, our net operating loss carryforwards are currently
available for use on our income tax returns to offset future taxable income.
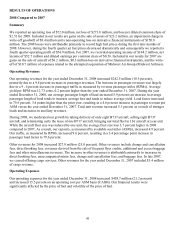
2007 Compared to 2006
Summary
We reported operating income of $144.2 million, net income of $52.7 million and diluted earnings per common
share of $0.56 for the year ended December 31, 2007. For 2006, we reported operating income of $40.9 million,
net income of $14.7 million, and diluted earnings per common share of $0.16.
Operating Revenues
Our operating revenues for the year ended December 31, 2007, increased $417.9 million (22.1 percent),
primarily due to a 21.2 percent increase in passenger revenues. The increase in passenger revenues was largely
due to a 25.0 percent increase in passenger traffic as measured by revenue passenger miles (RPMs), net of the
impact of a decrease in our average yield per RPM of 3.1 percent to 12.71 cents. The decrease in yield resulted
primarily from an increase in the average stage length of 6.6 percent to 695 miles. Our average fare increased
2.2 percent to $92.47. The 3.4 percentage point increase in load factor combined with the 3.1 percent decrease
in yield resulted in a 1.5 percent increase in passenger unit revenues as measured by passenger revenue per
available seat mile (RASM) to 9.69 cents.
During the year ended December 31, 2007, we took delivery and placed in service ten B737 aircraft. As a result,
our capacity, as measured by available seat miles (ASMs), increased 19.4 percent. The combination of our 19.4
percent increase in capacity and 25.0 percent increase in traffic resulted in a 3.4 percentage point increase in
passenger load factor to 76.2 percent.
Other revenues for 2007 increased $34.3 million (46.8 percent). Other revenues include change and cancellation
fees, direct booking fees, revenues derived from the sale of frequent flyer credits, excess baggage fees and other
miscellaneous revenues. The increase in other revenues was attributable primarily to increases in change and
cancellation fees, direct booking fees, and sales of frequent flyer credits.
Operating Expenses
Our operating expenses for the year ended December 31, 2007, increased $314.6 million (17.0 percent), but
decreased 2.1 percent on an operating cost per ASM basis (CASM). Our financial results were significantly
affected by the price of fuel and volatility in the price of fuel.
44