Whirlpool 2015 Annual Report Download - page 6
Download and view the complete annual report
Please find page 6 of the 2015 Whirlpool annual report below. You can navigate through the pages in the report by either clicking on the pages listed below, or by using the keyword search tool below to find specific information within the annual report.-
 1
1 -
 2
2 -
 3
3 -
 4
4 -
 5
5 -
 6
6 -
 7
7 -
 8
8 -
 9
9 -
 10
10 -
 11
11 -
 12
12 -
 13
13 -
 14
14 -
 15
15 -
 16
16 -
 17
17 -
18
-
19
-
20
-
21
-
22
-
23
-
24
-
25
-
26
-
27
-
28
-
29
-
30
-
31
-
32
-
33
-
34
-
35
-
36
-
37
-
38
-
39
-
40
-
41
-
42
-
43
-
44
-
45
-
46
-
47
-
48
-
49
-
50
-
51
-
52
-
53
-
54
-
55
-
56
-
57
-
58
 |
 |
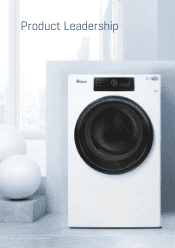
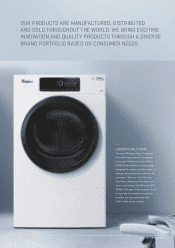
Additionally, we continued to invest in new product introductions
and in the equity of our leading brand portfolio, which currently
contains seven brands that each generate more than $1 billion in
annual sales. These investments have allowed us to launch more
than 100 innovative new products in 2015. Our portfolio has breadth
and consumer preference that are unmatched in the industry.
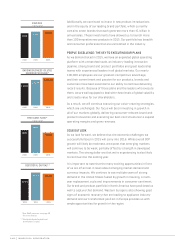
PEOPLE EXCELLENCE: THE KEY TO EXECUTING OUR PLANS
As we demonstrated in 2015, we have an expanded global operating
platform with unmatched scale, an industry-leading innovation
pipeline, strong brand and product portfolios and great leadership
teams with experienced leaders in all global markets. Our nearly
100,000 employees are our greatest competitive advantage,
and their commitment and passion for our products, brands and
customers have been essential to our ability to continue delivering
record results. Because of those plans and the leaders who execute
them, we are well equipped to deal with these levels of global volatility
and create value for our shareholders.
As a result, we will continue executing our value-creating strategies,
which are unchanged. Our focus will be on investing in growth in
all of our markets globally, delivering consumer-relevant brand and
product innovation and executing our best cost structures to expand
operating margins and grow revenues.
2016 OUTLOOK
As we look forward, we believe that the economic challenges we
successfully faced in 2015 will carry into 2016. While overall GDP
growth will likely be moderate, we expect that emerging markets
will continue to be weak, partially offset by strength in developed
markets. The strong dollar era that we’re experiencing is also likely
to continue into the coming year.
It is important to note that the many exciting opportunities in front
of us are often lost in news about emerging market demand and
currency impacts. We continue to see multiple years of strong
demand in the United States fueled by growth in housing, a multi-
year replacement cycle and improvements in consumer sentiment.
Our brand and product portfolio in North America have positioned us
well to capture that demand. Western Europe is also showing good
signs of economic recovery that are leading to appliance industry
demand and our transformed position in Europe provides us with
ample opportunities for growth in the region.
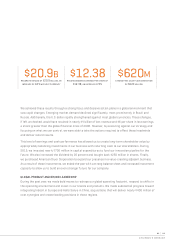
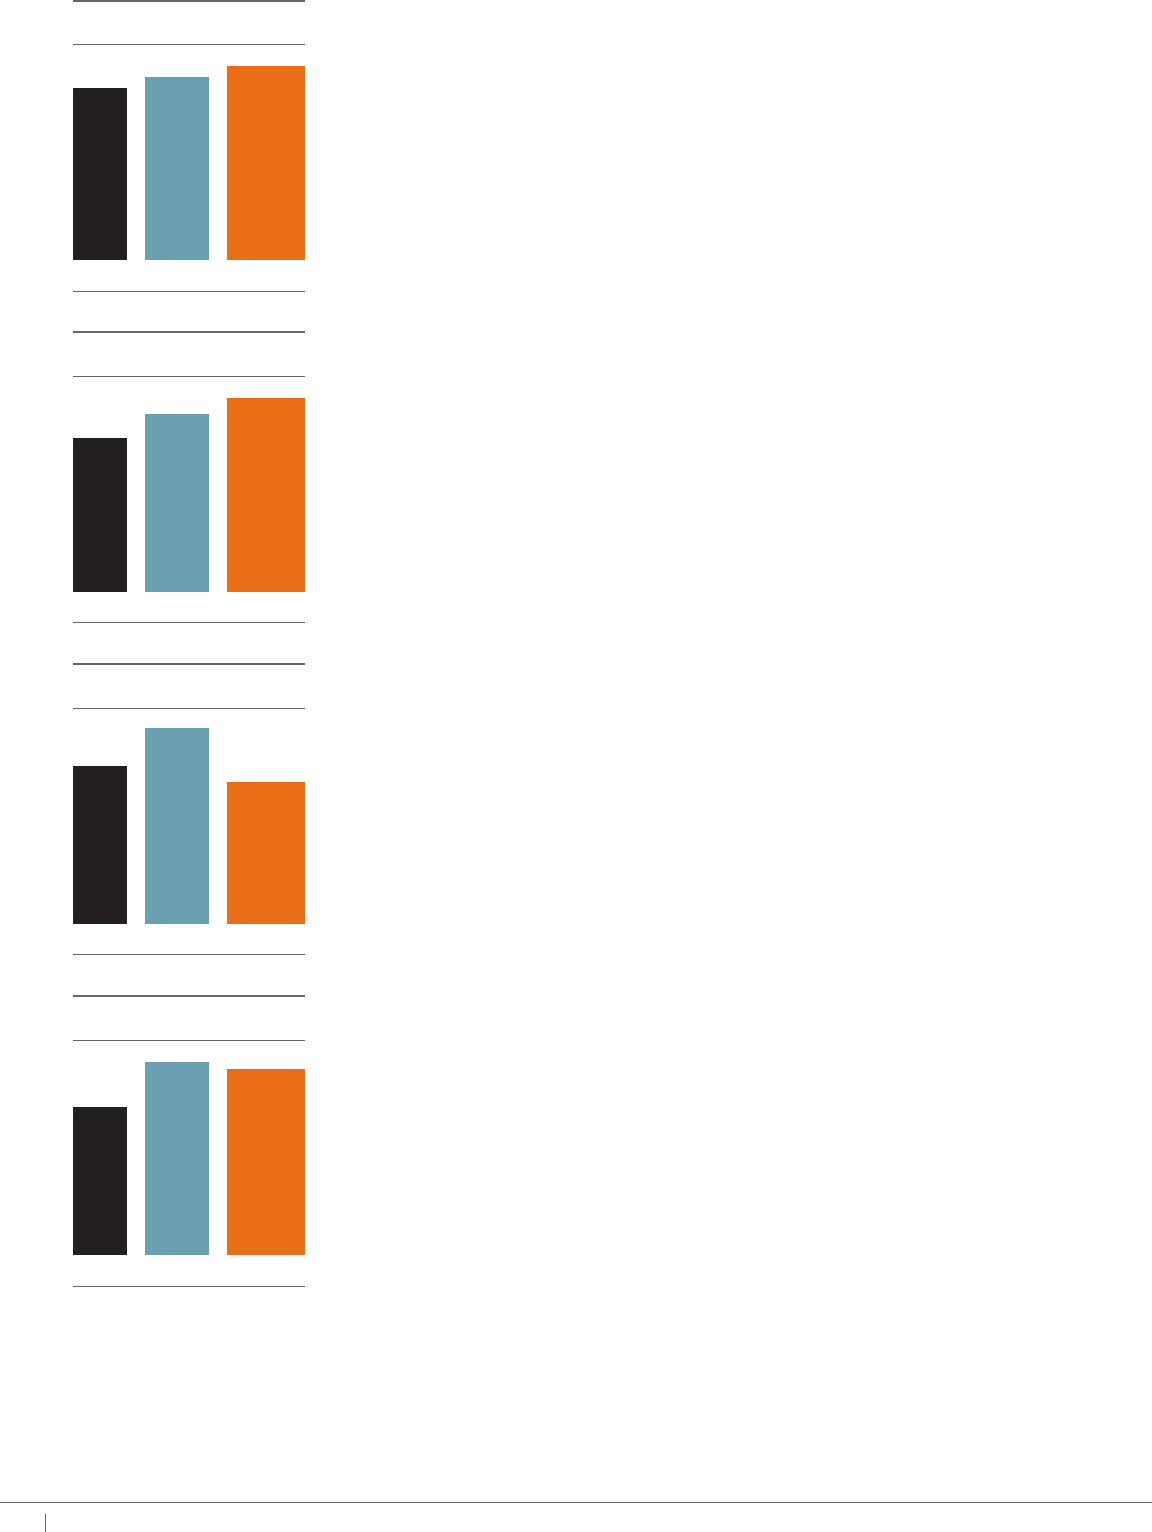
2015 WHIRLPOOL CORPORATION
REVENUE
$ IN BILLIONS
2013 2014 2015
$18.8 $19.9 $20.9
*Non-GAAP measure; see page 40
for reconciliation.
ONGOING BUSINESS DILUTED
EARNINGS PER SHARE*
2013 2014 2015
$10.02
$11.39
$12.38
FREE CASH FLOW*
$ IN MILLIONS
2013 2014 2015
$690
$854
$620
**Total debt divided by debt and
stockholders’ equity.
DEBT/TOTAL CAPITAL**
2013 2014 2015
33.0%
42.9% 41.3%