Whirlpool 2015 Annual Report Download - page 41
Download and view the complete annual report
Please find page 41 of the 2015 Whirlpool annual report below. You can navigate through the pages in the report by either clicking on the pages listed below, or by using the keyword search tool below to find specific information within the annual report.-
 1
1 -
2
-
3
-
4
-
5
-
6
-
7
-
8
-
9
-
10
-
11
-
12
-
13
-
14
-
15
-
16
-
17
-
18
-
19
-
20
-
21
-
22
-
23
-
24
-
25
-
26
-
27
-
28
-
29
-
30
-
 31
31 -
 32
32 -
 33
33 -
 34
34 -
 35
35 -
 36
36 -
 37
37 -
 38
38 -
 39
39 -
 40
40 -
 41
41 -
 42
42 -
 43
43 -
 44
44 -
 45
45 -
 46
46 -
 47
47 -
 48
48 -
 49
49 -
 50
50 -
 51
51 -
52
-
53
-
54
-
55
-
56
-
57
-
58
 |
 |

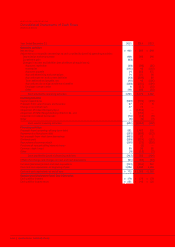
Financial Summary
The following pages include Whirlpool Corporation’s financial condition
and results of operations for 2015, 2014 and 2013. For a more complete
understanding of our financial condition and results, this summary
should be read together with Whirlpool Corporation’s Financial Statements
and related notes, and “Management’s Discussion
and Analysis.” This
information appears in the Company’s 2015 Annual Report on Form
10-K filed with the Securities and Exchange Commission, which is available
on the company’s website at investors.whirlpoolcorp.com/sec.cfm.
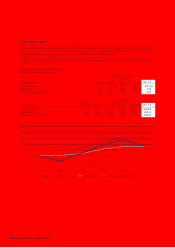
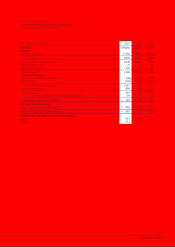
FORWARD-LOOKING PERSPECTIVE
We currently estimate earnings per diluted share and industry demand for 2016 to be within the following ranges:
2016
Current Outlook
Estimated earnings per diluted share, for the year ending December 31, 2016 $11.25–$12.00
Including:
Restructuring Expense $(2.40)
Combined Acquisition Related Transition Costs $(0.30)
Industry demand
North America +5%
EMEA 0%–+2%
Latin America(1) (10%)
Asia Flat
(1) Primarily reflects industry demand in Brazil.
For the full-year 2016, we expect to generate free cash flow between $700 million and $800 million, including restructuring cash
outlays of up to $200 million, capital expenditures of $700 million to $750 million and EMEA legacy product warranty costs of
$155 million.
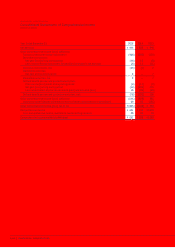
The table below reconciles projected 2016 cash provided by operating activities determined in accordance with GAAP to free
cash flow, a non-GAAP measure. Management believes that free cash flow provides stockholders with a relevant measure of
liquidity and a useful basis for assessing Whirlpool’s ability to fund its activities and obligations. There are limitations to using
non-GAAP financial measures, including the difficulty associated with comparing companies that use similarly named non-GAAP
measures whose calculations may differ from our calculations. We define free cash flow as cash provided by operating activi-
ties less capital expenditures and including proceeds from the sale of assets/businesses, and changes in restricted cash. The
change in restricted cash relates to the private placement funds paid by Whirlpool to acquire majority control of Hefei Sanyo in
2014 and which are used to fund capital and technical resources to enhance Whirlpool China’s research and development and
working capital.
(Millions of dollars)
2016
Current Outlook
Cash provided by operating activities $1,400–$1,550
Capital expenditures, proceeds from sale of assets/businesses and changes in restricted cash (700)–(750)
Free cash flow $700–$800
The projections above are based on many estimates and are inherently subject to change based on future decisions made by
management and the Board of Directors of Whirlpool, and significant economic, competitive and other uncertainties and
contingencies.
FINANCIAL SUMMARY
38 39