Vodafone 2002 Annual Report Download - page 98
Download and view the complete annual report
Please find page 98 of the 2002 Vodafone annual report below. You can navigate through the pages in the report by either clicking on the pages listed below, or by using the keyword search tool below to find specific information within the annual report.-
 1
1 -
2
-
3
-
4
-
5
-
6
-
7
-
8
-
9
-
10
-
11
-
12
-
13
-
14
-
15
-
16
-
17
-
18
-
19
-
20
-
21
-
22
-
23
-
24
-
25
-
26
-
27
-
28
-
29
-
30
-
31
-
32
-
33
-
34
-
35
-
36
-
37
-
38
-
39
-
40
-
41
-
42
-
43
-
44
-
45
-
46
-
47
-
48
-
49
-
50
-
51
-
52
-
53
-
54
-
55
-
56
-
57
-
58
-
59
-
60
-
61
-
62
-
63
-
64
-
65
-
66
-
67
-
68
-
69
-
70
-
71
-
72
-
73
-
74
-
75
-
76
-
77
-
78
-
79
-
80
-
81
-
82
-
83
-
84
-
85
-
86
-
87
-
 88
88 -
 89
89 -
 90
90 -
 91
91 -
 92
92 -
 93
93 -
 94
94 -
 95
95 -
 96
96 -
 97
97 -
 98
98 -
 99
99 -
 100
100 -
 101
101 -
 102
102 -
 103
103 -
 104
104 -
 105
105 -
 106
106 -
 107
107 -
 108
108 -
109
-
110
-
111
-
112
-
113
-
114
-
115
-
116
-
117
-
118
-
119
-
120
-
121
-
122
-
123
-
124
-
125
-
126
-
127
-
128
-
129
-
130
-
131
-
132
-
133
-
134
-
135
-
136
-
137
-
138
-
139
-
140
-
141
-
142
-
143
-
144
-
145
-
146
-
147
-
148
-
149
-
150
-
151
-
152
-
153
-
154
-
155
-
156
 |
 |

Vodafone Group Plc Annual Report & Accounts and Form 20-F Notes to the Consolidated Financial Statements96
Notes to the Consolidated Financial Statements continued
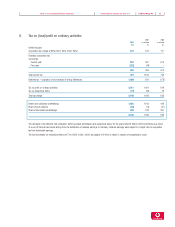
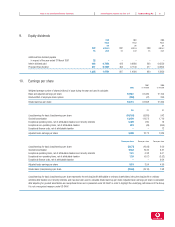
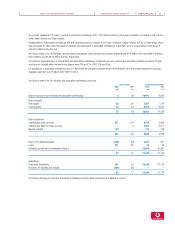
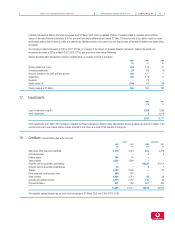
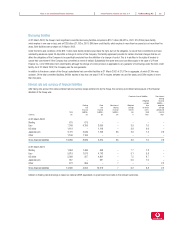
The Group’s share of turnover, profits and losses, assets and liabilities of Verizon Wireless included in the above analysis is as follows:
2002 2001
£m £m
Share of:
Turnover 5,602 5,000
Profit before taxation and goodwill amortisation 1,058 926
Goodwill amortisation (1,259) (1,229)
Loss on ordinary activities before taxation (201) (303)
Tax on loss on ordinary activities (66) (53)
Loss on ordinary activities after taxation (267) (356)
Fixed assets 5,777 5,027
Current assets 1,678 1,342
Liabilities due within one year (3,782) (3,529)
Liabilities due after more than one year (2,148) (2,394)
Minority interests (123) (123)
Share of net assets 1,402 323
Attributed goodwill net of amortisation charges 19,748 21,034
Share of net assets and attributed goodwill 21,150 21,357
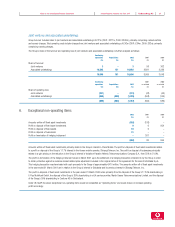
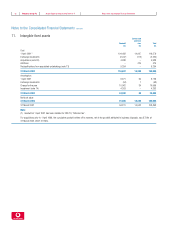
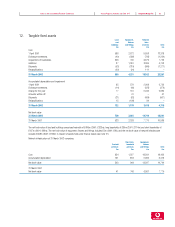
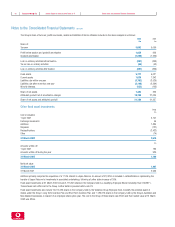
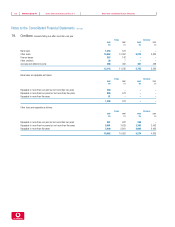
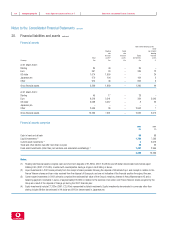
Other fixed asset investments
Group
£m
Cost or valuation
1 April 2001 3,141
Exchange movements 55
Additions 1,884
Disposals (121)
Reclassifications (2,432)
Other (14)
31 March 2002 2,513
£m
Amounts written off
1 April 2001 186
Amounts written off during the year 920
31 March 2002 1,106
Net book value
31 March 2002 1,407
31 March 2001 2,955
Additions primarily comprise the acquisition of a 17.5% interest in Japan Telecom. An amount of £2,429m is included in reclassifications, representing the
transfer of Japan Telecom to investments in associated undertakings, following a further stake increase of 20%.
Fixed asset investments at 31 March 2002 include 2,113,243 shares in the Company held by a Qualifying Employee Share Ownership Trust (“QUEST”).
These shares had a £Nil cost to the Group. Further detail is provided within note 23.
Fixed asset investments also include 15,074,436 shares in the Company, held by the Vodafone Group Employee Trust, to satisfy the potential award of
shares under the Group’s Long Term Incentive Plan and Short Term Incentive Plan, and 7,189,316 shares in the Company, held by the Group’s Australian and
New Zealand businesses, in respect of an employee share option plan. The cost to the Group of these shares was £33m and their market value at 31 March
2002 was £29m.