Vodafone 2002 Annual Report Download - page 93
Download and view the complete annual report
Please find page 93 of the 2002 Vodafone annual report below. You can navigate through the pages in the report by either clicking on the pages listed below, or by using the keyword search tool below to find specific information within the annual report.-
 1
1 -
2
-
3
-
4
-
5
-
6
-
7
-
8
-
9
-
10
-
11
-
12
-
13
-
14
-
15
-
16
-
17
-
18
-
19
-
20
-
21
-
22
-
23
-
24
-
25
-
26
-
27
-
28
-
29
-
30
-
31
-
32
-
33
-
34
-
35
-
36
-
37
-
38
-
39
-
40
-
41
-
42
-
43
-
44
-
45
-
46
-
47
-
48
-
49
-
50
-
51
-
52
-
53
-
54
-
55
-
56
-
57
-
58
-
59
-
60
-
61
-
62
-
63
-
64
-
65
-
66
-
67
-
68
-
69
-
70
-
71
-
72
-
73
-
74
-
75
-
76
-
77
-
78
-
79
-
80
-
81
-
82
-
 83
83 -
 84
84 -
 85
85 -
 86
86 -
 87
87 -
 88
88 -
 89
89 -
 90
90 -
 91
91 -
 92
92 -
 93
93 -
 94
94 -
 95
95 -
 96
96 -
 97
97 -
 98
98 -
 99
99 -
 100
100 -
 101
101 -
 102
102 -
 103
103 -
104
-
105
-
106
-
107
-
108
-
109
-
110
-
111
-
112
-
113
-
114
-
115
-
116
-
117
-
118
-
119
-
120
-
121
-
122
-
123
-
124
-
125
-
126
-
127
-
128
-
129
-
130
-
131
-
132
-
133
-
134
-
135
-
136
-
137
-
138
-
139
-
140
-
141
-
142
-
143
-
144
-
145
-
146
-
147
-
148
-
149
-
150
-
151
-
152
-
153
-
154
-
155
-
156
 |
 |

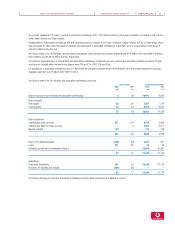
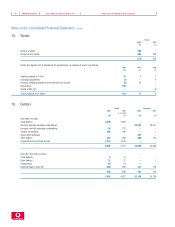
Notes to the Consolidated Financial Statements Vodafone Group Plc 91Annual Report & Accounts and Form 20-F
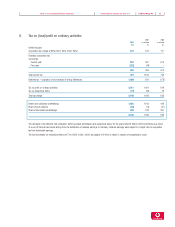
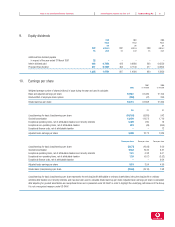
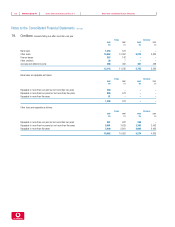
9. Equity dividends
2002 2001 2000
Pence Pence Pence
per per per
2002 ordinary 2001 ordinary 2000 ordinary
£m share £m share £m share
Additional final dividend payable
in respect of the year ended 31 March 2001 22 –––––
Interim dividend paid 492 0.7224 423 0.6880 203 0.6550
Proposed final dividend 511 0.7497 464 0.7140 417 0.6800
1,025 1.4721 887 1.4020 620 1.3350
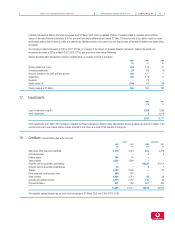
10. Earnings per share
2001 2000
2002 as restated as restated
Weighted average number of shares (millions) in issue during the year and used to calculate:
Basic and adjusted earnings per share 67,961 61,439 27,100
Dilutive effect of employee share options (246) (41) 260
Diluted earnings per share 67,715 61,398 27,360
£m £m £m
(Loss)/earnings for basic (loss)/earnings per share (16,155) (9,885) 542
Goodwill amortisation 13,470 11,873 1,710
Exceptional operating items, net of attributable taxation and minority interests 5,309 230 19
Exceptional non-operating items, net of attributable taxation 874 (45) (954)
Exceptional finance costs, net of attributable taxation ––12
Adjusted basic earnings per share 3,498 2,173 1,329
Pence per share Pence per share Pence per share
(Loss)/earnings for basic (loss)/earnings per share (23.77) (16.09) 2.00
Goodwill amortisation 19.82 19.32 6.31
Exceptional operating items, net of attributable taxation and minority interests 7.81 0.38 0.07
Exceptional non-operating items, net of attributable taxation 1.29 (0.07) (3.52)
Exceptional finance costs, net of attributable taxation ––0.04
Adjusted basic earnings per share 5.15 3.54 4.90
Diluted basic (loss)/earnings per share (23.86) (16.10) 1.98
(Loss)/earnings for basic (loss)/earnings per share represents the net (loss)/profit attributable to ordinary shareholders, being the (loss)/profit on ordinary
activities after taxation and minority interests, and has also been used to calculate diluted earnings per share. Adjusted basic earnings per share is calculated
after adjusting for goodwill amortisation and exceptional items and is presented under UK GAAP in order to highlight the underlying performance of the Group.
It is not a recognised measure under US GAAP.