Vodafone 2002 Annual Report Download - page 4
Download and view the complete annual report
Please find page 4 of the 2002 Vodafone annual report below. You can navigate through the pages in the report by either clicking on the pages listed below, or by using the keyword search tool below to find specific information within the annual report.-
 1
1 -
 2
2 -
 3
3 -
 4
4 -
 5
5 -
 6
6 -
 7
7 -
 8
8 -
 9
9 -
 10
10 -
 11
11 -
 12
12 -
 13
13 -
 14
14 -
 15
15 -
16
-
17
-
18
-
19
-
20
-
21
-
22
-
23
-
24
-
25
-
26
-
27
-
28
-
29
-
30
-
31
-
32
-
33
-
34
-
35
-
36
-
37
-
38
-
39
-
40
-
41
-
42
-
43
-
44
-
45
-
46
-
47
-
48
-
49
-
50
-
51
-
52
-
53
-
54
-
55
-
56
-
57
-
58
-
59
-
60
-
61
-
62
-
63
-
64
-
65
-
66
-
67
-
68
-
69
-
70
-
71
-
72
-
73
-
74
-
75
-
76
-
77
-
78
-
79
-
80
-
81
-
82
-
83
-
84
-
85
-
86
-
87
-
88
-
89
-
90
-
91
-
92
-
93
-
94
-
95
-
96
-
97
-
98
-
99
-
100
-
101
-
102
-
103
-
104
-
105
-
106
-
107
-
108
-
109
-
110
-
111
-
112
-
113
-
114
-
115
-
116
-
117
-
118
-
119
-
120
-
121
-
122
-
123
-
124
-
125
-
126
-
127
-
128
-
129
-
130
-
131
-
132
-
133
-
134
-
135
-
136
-
137
-
138
-
139
-
140
-
141
-
142
-
143
-
144
-
145
-
146
-
147
-
148
-
149
-
150
-
151
-
152
-
153
-
154
-
155
-
156
 |
 |

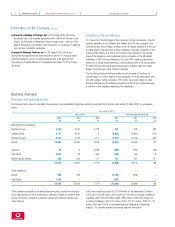
Vodafone Group Plc Annual Report & Accounts and Form 20-F Group Financial Highlights2
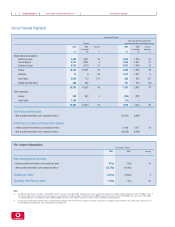
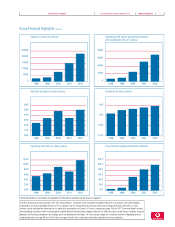
Group Financial Highlights
Year ended 31 March
Total Group operating profit before
Turnover goodwill amortisation and exceptional items
2002 2001 Increase 2002 2001(2) Increase/
As restated As restated (decrease)
£m £m % £m £m %
Mobile telecommunications:
Northern Europe 5,432 4,511 20 1,685 1,284 31
Central Europe 4,177 4,031 4 1,543 1,097 41
Southern Europe 6,743 4,479 51 2,072 1,449 43
Europe 16,352 13,021 26 5,300 3,830 38
Americas 12 933 1,317 1,237 6
Asia Pacific 4,072 713 471 589 205 187
Middle East and Africa 306 308 161 213 (24)
20,742 14,051 48 7,367 5,485 34
Other operations:
Europe 998 953 5 (306) (281)
Asia Pacific 1,105 –(17) –
22,845 15,004 52 7,044 5,204 35
Total Group operating loss
– after goodwill amortisation and exceptional items (1) (11,834) (6,989)
Profit/(loss) on ordinary activities before taxation
– before goodwill amortisation and exceptional items 6,199 4,027 54
– after goodwill amortisation and exceptional items (1) (13,539) (8,086)
Per share information
Year ended 31 March
2002 2001(2) Increase
%
Basic earnings/(loss) per share
– before goodwill amortisation and exceptional items 5.15p 3.54p 45
– after goodwill amortisation and exceptional items (1) (23.77)p (16.09)p
Dividend per share 1.4721p 1.4020p 5
Operating cash flow per share 11.92p 7.47p 60
Notes
(1) Goodwill amortisation charge of £13,470m, compared with £11,873m for the year ended 31 March 2001. Exceptional items comprise exceptional operating costs of £5,408m, including an impairment charge of £5,100m in respect of
Arcor, Cegetel, Japan Telecom and Grupo Iusacell, and exceptional non-operating items of £860m including an impairment charge of £900m in respect of the Group’s investment in China Mobile. For the year ended 31 March 2001,
exceptional operating and non-operating items totalled £320m and £(80)m, respectively. Further details are given in notes 4, 6 and 14 to the Consolidated Financial Statements.
(2) Certain prior period comparative information has been restated following the adoption of FRS 19, “Deferred tax”, during the year and the restatement of the geographical segments during the year. Further details are given in note 1 to
the Consolidated Financial Statements, “Basis of Consolidated Financial Statements”.