Vodafone 2002 Annual Report Download - page 107
Download and view the complete annual report
Please find page 107 of the 2002 Vodafone annual report below. You can navigate through the pages in the report by either clicking on the pages listed below, or by using the keyword search tool below to find specific information within the annual report.-
 1
1 -
2
-
3
-
4
-
5
-
6
-
7
-
8
-
9
-
10
-
11
-
12
-
13
-
14
-
15
-
16
-
17
-
18
-
19
-
20
-
21
-
22
-
23
-
24
-
25
-
26
-
27
-
28
-
29
-
30
-
31
-
32
-
33
-
34
-
35
-
36
-
37
-
38
-
39
-
40
-
41
-
42
-
43
-
44
-
45
-
46
-
47
-
48
-
49
-
50
-
51
-
52
-
53
-
54
-
55
-
56
-
57
-
58
-
59
-
60
-
61
-
62
-
63
-
64
-
65
-
66
-
67
-
68
-
69
-
70
-
71
-
72
-
73
-
74
-
75
-
76
-
77
-
78
-
79
-
80
-
81
-
82
-
83
-
84
-
85
-
86
-
87
-
88
-
89
-
90
-
91
-
92
-
93
-
94
-
95
-
96
-
 97
97 -
 98
98 -
 99
99 -
 100
100 -
 101
101 -
 102
102 -
 103
103 -
 104
104 -
 105
105 -
 106
106 -
 107
107 -
 108
108 -
 109
109 -
 110
110 -
 111
111 -
 112
112 -
 113
113 -
 114
114 -
 115
115 -
 116
116 -
 117
117 -
118
-
119
-
120
-
121
-
122
-
123
-
124
-
125
-
126
-
127
-
128
-
129
-
130
-
131
-
132
-
133
-
134
-
135
-
136
-
137
-
138
-
139
-
140
-
141
-
142
-
143
-
144
-
145
-
146
-
147
-
148
-
149
-
150
-
151
-
152
-
153
-
154
-
155
-
156
 |
 |

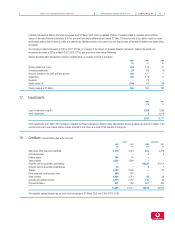
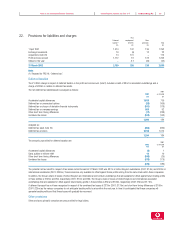
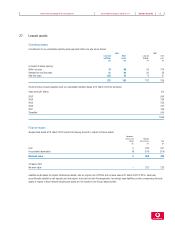
Notes to the Consolidated Financial Statements Vodafone Group Plc 105Annual Report & Accounts and Form 20-F
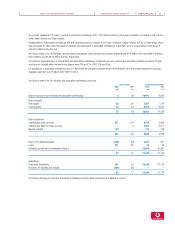
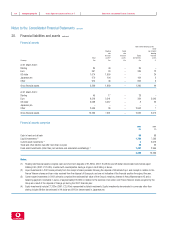
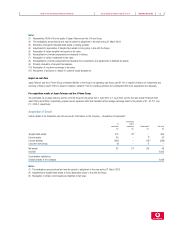
21. Financial instruments
Fair values of financial assets and liabilities
The carrying amounts and estimated fair value of the Group’s outstanding financial instruments are set out below:
2002 2002 2001 2001
Net Estimated Net Estimated
carrying fair carrying fair
amount value amount value
£m £m £m £m
Fixed asset investments (excluding investments in joint ventures
and associated undertakings) 1,407 1,653 2,955 2,350
Cash at bank and in hand and liquid investments 1,789 1,789 7,661 7,661
Current asset investments 335,618 5,618
Borrowings:
Short-term 1,319 1,319 3,611 3,611
Long-term 12,584 13,075 10,772 11,058
Derivative financial instruments:
Interest rate 210 274 – 2
Foreign exchange (28) (27) –(1)
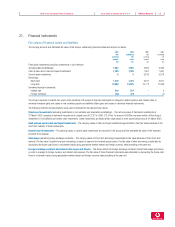
The Group’s exposure to market risk, which is the sensitivity of the value of financial instruments to changes in related currency and interest rates, is
minimised because gains and losses on the underlying assets and liabilities offset gains and losses on derivative financial instruments.
The following methods and assumptions were used to estimate the fair values shown above.
Fixed asset investments (excluding investments in joint ventures and associated undertakings) – The net book value of fixed asset investments at
31 March 2002 comprises investments recorded at an original cost of £2,327m (2001: £3,141m). An amount of £920m has been written off the Group’s
investment in China Mobile and certain other investments. Listed investments are stated at fair value based on their quoted share price at 31 March 2002.
Cash at bank and in hand and liquid investments – The carrying values of cash and liquid investments approximate to their fair values because of the
short-term maturity of these instruments.
Current asset investments –The carrying values of current asset investments are recorded in the accounts at the estimated fair value of the expected
proceeds from disposal.
Borrowings (excluding foreign exchange contracts) – The carrying values of short-term borrowings approximate to fair value because of their short-term
maturity. The fair value of quoted long-term borrowings is based on year end mid-market quoted prices. The fair value of other borrowings is estimated by
discounting the future cash flows to net present values using appropriate market interest and foreign currency rates prevailing at the year end.
Foreign exchange contracts and interest rate swaps and futures – The Group enters into foreign exchange contracts, interest rate swaps and futures
in order to manage its foreign currency and interest rate exposure. The fair value of these financial instruments was estimated by discounting the future cash
flows to net present values using appropriate market interest and foreign currency rates prevailing at the year end.