Vodafone 2002 Annual Report Download - page 106
Download and view the complete annual report
Please find page 106 of the 2002 Vodafone annual report below. You can navigate through the pages in the report by either clicking on the pages listed below, or by using the keyword search tool below to find specific information within the annual report.-
 1
1 -
2
-
3
-
4
-
5
-
6
-
7
-
8
-
9
-
10
-
11
-
12
-
13
-
14
-
15
-
16
-
17
-
18
-
19
-
20
-
21
-
22
-
23
-
24
-
25
-
26
-
27
-
28
-
29
-
30
-
31
-
32
-
33
-
34
-
35
-
36
-
37
-
38
-
39
-
40
-
41
-
42
-
43
-
44
-
45
-
46
-
47
-
48
-
49
-
50
-
51
-
52
-
53
-
54
-
55
-
56
-
57
-
58
-
59
-
60
-
61
-
62
-
63
-
64
-
65
-
66
-
67
-
68
-
69
-
70
-
71
-
72
-
73
-
74
-
75
-
76
-
77
-
78
-
79
-
80
-
81
-
82
-
83
-
84
-
85
-
86
-
87
-
88
-
89
-
90
-
91
-
92
-
93
-
94
-
95
-
 96
96 -
 97
97 -
 98
98 -
 99
99 -
 100
100 -
 101
101 -
 102
102 -
 103
103 -
 104
104 -
 105
105 -
 106
106 -
 107
107 -
 108
108 -
 109
109 -
 110
110 -
 111
111 -
 112
112 -
 113
113 -
 114
114 -
 115
115 -
 116
116 -
117
-
118
-
119
-
120
-
121
-
122
-
123
-
124
-
125
-
126
-
127
-
128
-
129
-
130
-
131
-
132
-
133
-
134
-
135
-
136
-
137
-
138
-
139
-
140
-
141
-
142
-
143
-
144
-
145
-
146
-
147
-
148
-
149
-
150
-
151
-
152
-
153
-
154
-
155
-
156
 |
 |

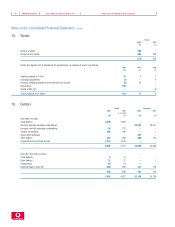
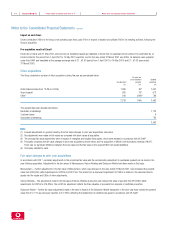
Vodafone Group Plc Annual Report & Accounts and Form 20-F Notes to the Consolidated Financial Statements104
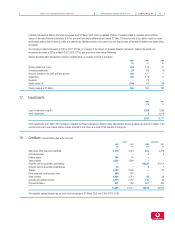
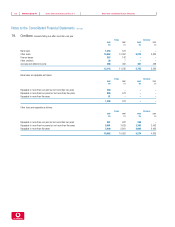
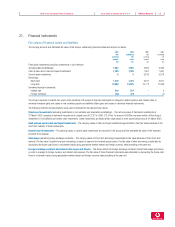
Notes to the Consolidated Financial Statements continued
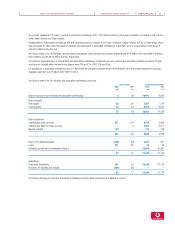
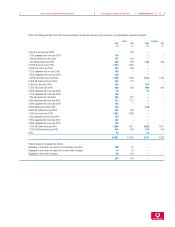
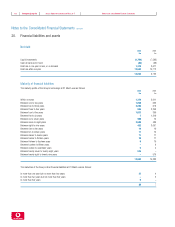
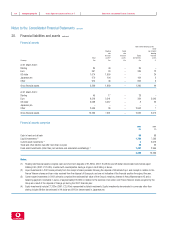
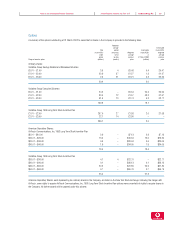
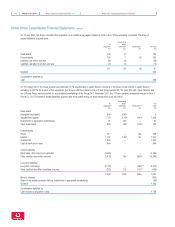
20. Financial liabilities and assets continued
Financial assets
Non-interest bearing assets
Other
Floating Fixed non-interest
rate rate bearing
financial financial Equity financial
Total assets(1) assets investments assets
Currency £m £m £m £m %
At 31 March 2002:
Sterling 84 49 –35 –
Euro 367 20 –335 12
US dollar 1,674 1,650 ––24
Japanese yen 270 104 –164 2
Other 914 46 –862 6
Gross financial assets 3,309 1,869 –1,396 44
At 31 March 2001:
Sterling 45 17 –28 –
Euro 8,518 2,541 –334 5,643
US dollar 5,098 5,067 –823
Japanese yen –––––
Other 2,605 36 – 2,562 7
Gross financial assets 16,266 7,661 – 2,932 5,673
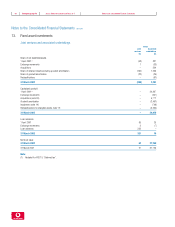
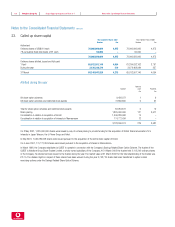
Financial assets comprise
2002 2001
£m £m
Cash in hand and at bank 80 68
Liquid investments (2) 1,789 7,593
Current asset investments (3) 35,618
Trade and other debtors due after more than one year 30 32
Fixed asset investments (other than joint ventures and associated undertakings) (4) 1,407 2,955
3,309 16,266
Notes:
(1) Floating rate financial assets comprise cash and short-term deposits of £1,865m (2001: £4,484m) and US dollar denominated commercial paper
totalling £4m (2001: £1,162m), invested with counterparties having a single-A credit rating or above.
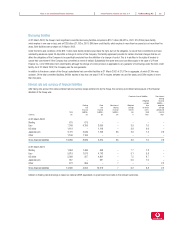
(2) Liquid investments in 2001 arose primarily from the receipt of sales proceeds following the disposal of Infostrada S.p.A. and receipts in relation to the
France Telecom shares and loan notes received from the disposal of Orange plc and are not indicative of the financial position throughout the year.
(3) Current asset investments in 2001 primarily comprised the estimated fair value of the Group’s remaining interest in Atecs Mannesmann AG and a
balancing payment, receivable in euros, of approximately £3,092m in relation to the exercise of an option over France Telecom shares acquired by the
Group as a result of the disposal of Orange plc during the 2001 financial year.
(4) Equity investments include £1,333m (2001: £2,510m) represented by listed investments. Equity investments denominated in currencies other than
sterling include £848m denominated in HK dollar and £115m denominated in Japanese yen.