Vodafone 2002 Annual Report Download - page 119
Download and view the complete annual report
Please find page 119 of the 2002 Vodafone annual report below. You can navigate through the pages in the report by either clicking on the pages listed below, or by using the keyword search tool below to find specific information within the annual report.-
 1
1 -
2
-
3
-
4
-
5
-
6
-
7
-
8
-
9
-
10
-
11
-
12
-
13
-
14
-
15
-
16
-
17
-
18
-
19
-
20
-
21
-
22
-
23
-
24
-
25
-
26
-
27
-
28
-
29
-
30
-
31
-
32
-
33
-
34
-
35
-
36
-
37
-
38
-
39
-
40
-
41
-
42
-
43
-
44
-
45
-
46
-
47
-
48
-
49
-
50
-
51
-
52
-
53
-
54
-
55
-
56
-
57
-
58
-
59
-
60
-
61
-
62
-
63
-
64
-
65
-
66
-
67
-
68
-
69
-
70
-
71
-
72
-
73
-
74
-
75
-
76
-
77
-
78
-
79
-
80
-
81
-
82
-
83
-
84
-
85
-
86
-
87
-
88
-
89
-
90
-
91
-
92
-
93
-
94
-
95
-
96
-
97
-
98
-
99
-
100
-
101
-
102
-
103
-
104
-
105
-
106
-
107
-
108
-
 109
109 -
 110
110 -
 111
111 -
 112
112 -
 113
113 -
 114
114 -
 115
115 -
 116
116 -
 117
117 -
 118
118 -
 119
119 -
 120
120 -
 121
121 -
 122
122 -
 123
123 -
 124
124 -
 125
125 -
 126
126 -
 127
127 -
 128
128 -
 129
129 -
130
-
131
-
132
-
133
-
134
-
135
-
136
-
137
-
138
-
139
-
140
-
141
-
142
-
143
-
144
-
145
-
146
-
147
-
148
-
149
-
150
-
151
-
152
-
153
-
154
-
155
-
156
 |
 |

Notes to the Consolidated Financial Statements Vodafone Group Plc 117Annual Report & Accounts and Form 20-F
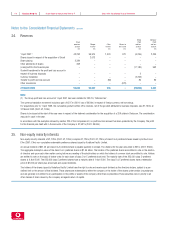
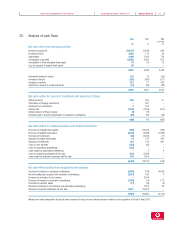
30. Analysis of cash flows
2002 2001 2000
as restated
£m £m £m
Net cash inflow from operating activities
Operating (loss)/profit (10,377) (6,439) 983
Exceptional items 4,486 176 30
Depreciation 2,880 1,593 746
Amortisation of goodwill 10,962 9,585 672
Amortisation of other intangible fixed assets 34 24 12
Loss on disposal of tangible fixed assets 46 ––
8,031 4,939 2,443
Decrease/(increase) in stocks 125 15 (65)
Increase in debtors (242) (350) (271)
Increase in creditors 215 67 433
Payments in respect of exceptional items (27) (84) (30)
8,102 4,587 2,510
Net cash outflow for returns on investments and servicing of finance
Interest received 259 296 57
Termination of hedging instruments –901 –
Dividends from investments 2102 –
Interest paid (1,104) (1,254) (370)
Interest element of finance leases (9) (11) –
Dividends paid to minority shareholders in subsidiary undertakings (84) (81) (93)
(936) (47) (406)
Net cash outflow for capital expenditure and financial investment
Purchase of intangible fixed assets (325) (13,163) (185)
Purchase of tangible fixed assets (4,145) (3,698) (1,848)
Purchase of investments (44) (3,254) (17)
Disposal of tangible fixed assets 75 275 294
Disposal of investments 319 513 991
Loans to joint ventures (233) (85) –
Loans to associated undertakings (523) ––
Loans repaid by associated undertakings –59
Loans to acquired businesses held for sale (116) (1,509) –
Loans repaid by acquired businesses held for sale 545 1,905 –
(4,447) (19,011) (756)
Net cash inflow/(outflow) from acquisitions and disposals
Purchase of interests in subsidiary undertakings (3,078) (219) (4,062)
Net (overdrafts)/cash acquired with subsidiary undertakings (2,514) 542 4
Proceeds on formation of joint venture –2,544 –
Purchase of interests in associated undertakings (7,159) (79) (717)
Purchase of customer bases (11) (15) (9)
Disposal of interests in joint ventures and associated undertakings –1,878 28
Disposal of acquired businesses held for sale 5,071 26,002 –
(7,691) 30,653 (4,756)
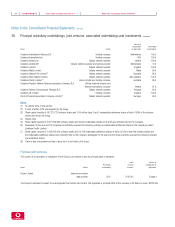
Material non-cash transactions during the year comprise the issue of new ordinary shares in relation to the acquisition of Eircell in May 2001.