Vodafone 2002 Annual Report Download - page 38
Download and view the complete annual report
Please find page 38 of the 2002 Vodafone annual report below. You can navigate through the pages in the report by either clicking on the pages listed below, or by using the keyword search tool below to find specific information within the annual report.-
 1
1 -
2
-
3
-
4
-
5
-
6
-
7
-
8
-
9
-
10
-
11
-
12
-
13
-
14
-
15
-
16
-
17
-
18
-
19
-
20
-
21
-
22
-
23
-
24
-
25
-
26
-
27
-
 28
28 -
 29
29 -
 30
30 -
 31
31 -
 32
32 -
 33
33 -
 34
34 -
 35
35 -
 36
36 -
 37
37 -
 38
38 -
 39
39 -
 40
40 -
 41
41 -
 42
42 -
 43
43 -
 44
44 -
 45
45 -
 46
46 -
 47
47 -
 48
48 -
49
-
50
-
51
-
52
-
53
-
54
-
55
-
56
-
57
-
58
-
59
-
60
-
61
-
62
-
63
-
64
-
65
-
66
-
67
-
68
-
69
-
70
-
71
-
72
-
73
-
74
-
75
-
76
-
77
-
78
-
79
-
80
-
81
-
82
-
83
-
84
-
85
-
86
-
87
-
88
-
89
-
90
-
91
-
92
-
93
-
94
-
95
-
96
-
97
-
98
-
99
-
100
-
101
-
102
-
103
-
104
-
105
-
106
-
107
-
108
-
109
-
110
-
111
-
112
-
113
-
114
-
115
-
116
-
117
-
118
-
119
-
120
-
121
-
122
-
123
-
124
-
125
-
126
-
127
-
128
-
129
-
130
-
131
-
132
-
133
-
134
-
135
-
136
-
137
-
138
-
139
-
140
-
141
-
142
-
143
-
144
-
145
-
146
-
147
-
148
-
149
-
150
-
151
-
152
-
153
-
154
-
155
-
156
 |
 |

Vodafone Group Plc Annual Report & Accounts and Form 20-F Operating and Financial Review and Prospects36
Operating and Financial Review and Prospects continued
In respect of the Group’s investment in China Mobile the review assessed the
carrying value against external analyst market valuations.
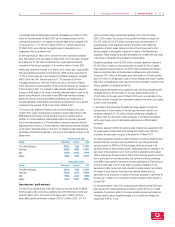
The results of the review indicated that, whilst no impairment charge was
necessary in respect of the Group’s controlled mobile businesses, further
impairment charges totalling £1,250 million were necessary in respect of non-
controlled mobile and non-mobile businesses. This brings the total charge for the
year to £6,000 million, as detailed below.
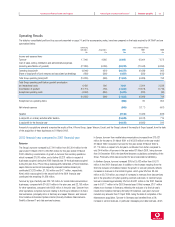
Total charge for year ended
31 March 2002
Company £m
Arcor 4,000
Japan Telecom 400
Cegetel 250
Grupo Iusacell 450
China Mobile 900
6,000
The charge in respect of China Mobile is included within non-operating
exceptional items.
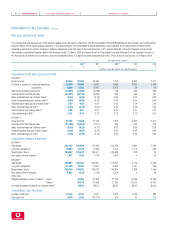
In Europe, total Group operating profit, before goodwill amortisation and
exceptional items, increased from £3,830 million for the year ended 31 March
2001 to £5,300 million for the year ended 31 March 2002. This increase
includes a contribution in respect of the acquired business, Vodafone Ireland, and
a full year’s consolidated results from Airtel. The remaining increase represents
organic growth in the Group’s major European markets, with all reporting
increases in EBITDA margins reflecting the Group’s realigned strategy to focus on
cost control and margin management.
In Northern Europe, total Group operating profits, before goodwill amortisation
and exceptional items, increased from £1,284 million to £1,685 million,
including the increase resulting from Vodafone Ireland. Vodafone UK increased its
total Group operating profit, before goodwill amortisation and exceptional costs,
from £795 million to £941 million and improved EBITDA margins from 31% to
34% as it delivered a re-balancing of resources into new product development,
product management and customer development activities as well as a 10%
reduction in headcount.
In Central Europe, total Group operating profit, before goodwill amortisation and
exceptional costs, increased 41% from £1,097 million for the year ended
31 March 2001 to £1,543 million for the year ended 31 March 2002. The majority
of the increase arose in Germany, principally as a result of the increase in service
revenues and reduction in equipment subsidies and lower connection commissions
payable due to lower customer growth. The EBITDA margin increased ten
percentage points to 45% at 31 March 2002. Results for Central Europe also
benefited from inclusion of a full year’s results from Swisscom Mobile.
In Southern Europe, total Group operating profit, before goodwill amortisation and
exceptional costs, increased 43% from £1,449 million for the year ended 31
March 2001 to £2,072 million for the year ended 31 March 2002, including the
effect of increases resulting from the Group’s increased ownership interest in
Airtel. In Italy, total Group operating profit, before goodwill amortisation and
exceptional costs, increased 25%, in line with growth in turnover. At 31 March
2002, the EBITDA margin was 46%, compared with 45% at 31 March 2001.
In the Americas Region, total Group operating profit, before goodwill amortisation
and exceptional costs, increased from £1,237 million for the year ended 31 March
2001 to £1,317 million for the year ended 31 March 2002. This increase reflects
the profitable trading of Verizon Wireless during the period, the first time inclusion
of results from Grupo Iusacell, and reduced losses in the Group’s Globalstar service
provider operations in North America. The Group has entered into an agreement to
sell its equity stake in its Globalstar operations. See “Business Activities – Mobile
Telecommunications – Geographic operations Americas”for further details.
In the Asia Pacific Region, total Group operating profit, before goodwill and
exceptional costs, increased from £205 million for the year ended 31 March
2001 to £589 million for the year ended 31 March 2002. All of the increase
relates to J-Phone Vodafone and is due to a combination of organic growth in
J-Phone Vodafone and as a result of J-Phone Vodafone becoming a subsidiary
undertaking of the Group on 12 October 2001. Prior to 12 October 2001,
J-Phone Vodafone was accounted for as an associated undertaking. Total Group
operating profit, before goodwill amortisation and exceptional items, in the
Group’s businesses in Australia, New Zealand and Fiji remained stable at
£66 million. Vodafone Australia faced particularly challenging market conditions,
with customer growth slowing from the levels experienced in previous years.
To address these challenges, the business was restructured to improve
operational efficiency, involving significant reductions in both capital and
operating expenditure, including a 28% reduction in the workforce.
In the Middle East and Africa Region, total Group operating profit, before goodwill
amortisation and exceptional costs, decreased from £213 million for the year
ended 31 March 2001 to £161 million for the year ended 31 March 2002.
The reduction in profit was largely attributable to the Group’s Egyptian subsidiary
which experienced difficult trading conditions during the period as a result of the
Egyptian pound’s devaluation.
The Group’s other operations reported an operating loss, before goodwill
amortisation and exceptional items of £323 million for the year ended 31 March
2002, compared with £281 million for the year ended 31 March 2001.
The results for the 2002 financial year include increased losses within Arcor, due
in part to the inclusion of a full year’s results, and the first time inclusion of the
statutory losses of Japan Telecom.
Consolidated costs of sales increased from £8,702 million in the year ended
31 March 2001 to £13,446 million in the year ended 31 March 2002, including
£3,554 million in respect of acquisitions completed during the year, principally
the acquisitions of the J-Phone Group and Japan Telecom. Costs of sales in
respect of continuing operations, £9,892 million, represented 55% of turnover
from continuing operations for the year ended 31 March 2002, compared with
58% for the year ended 31 March 2001.
The Group’s cost of sales consist primarily of financial incentives to service
providers and dealers, payments to landline and mobile operators for delivering
calls outside the Group’s networks and for providing landline or microwave links,
depreciation of network infrastructure, the cost of customer equipment sold and
network operating costs.
The Group’s cost of sales as a proportion of turnover decreased slightly in the
2002 financial year due primarily to the reduction in the proportion of turnover
spent on equipment costs and the costs of providing financial incentives to
dealers. This is discussed below.