United Healthcare 2013 Annual Report Download - page 91
Download and view the complete annual report
Please find page 91 of the 2013 United Healthcare annual report below. You can navigate through the pages in the report by either clicking on the pages listed below, or by using the keyword search tool below to find specific information within the annual report.-
 1
1 -
2
-
3
-
4
-
5
-
6
-
7
-
8
-
9
-
10
-
11
-
12
-
13
-
14
-
15
-
16
-
17
-
18
-
19
-
20
-
21
-
22
-
23
-
24
-
25
-
26
-
27
-
28
-
29
-
30
-
31
-
32
-
33
-
34
-
35
-
36
-
37
-
38
-
39
-
40
-
41
-
42
-
43
-
44
-
45
-
46
-
47
-
48
-
49
-
50
-
51
-
52
-
53
-
54
-
55
-
56
-
57
-
58
-
59
-
60
-
61
-
62
-
63
-
64
-
65
-
66
-
67
-
68
-
69
-
70
-
71
-
72
-
73
-
74
-
75
-
76
-
77
-
78
-
79
-
80
-
 81
81 -
 82
82 -
 83
83 -
 84
84 -
 85
85 -
 86
86 -
 87
87 -
 88
88 -
 89
89 -
 90
90 -
 91
91 -
 92
92 -
 93
93 -
 94
94 -
 95
95 -
 96
96 -
 97
97 -
 98
98 -
 99
99 -
 100
100 -
 101
101 -
102
-
103
-
104
-
105
-
106
-
107
-
108
-
109
-
110
-
111
-
112
-
113
-
114
-
115
-
116
-
117
-
118
-
119
-
120
 |
 |

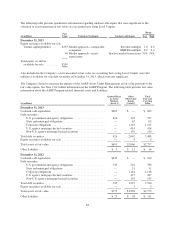
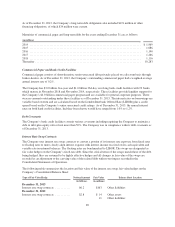
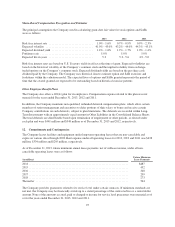
As of December 31, 2013, the Company’s long-term debt obligations also included $121 million of other
financing obligations, of which $34 million were current.
Maturities of commercial paper and long-term debt for the years ending December 31 are as follows:
(in millions)
2014 .............................................................................. $ 1,969
2015 .............................................................................. 1,086
2016 .............................................................................. 1,140
2017 .............................................................................. 1,266
2018 .............................................................................. 1,116
Thereafter .......................................................................... 10,283
Commercial Paper and Bank Credit Facilities
Commercial paper consists of short-duration, senior unsecured debt privately placed on a discount basis through
broker-dealers. As of December 31, 2013, the Company’s outstanding commercial paper had a weighted-average
annual interest rate of 0.2%.
The Company has $3.0 billion five-year and $1.0 billion 364-day revolving bank credit facilities with 23 banks,
which mature in November 2018 and November 2014, respectively. These facilities provide liquidity support for
the Company’s $4.0 billion commercial paper program and are available for general corporate purposes. There
were no amounts outstanding under these facilities as of December 31, 2013. The interest rates on borrowings are
variable based on term and are calculated based on the London Interbank Offered Rate (LIBOR) plus a credit
spread based on the Company’s senior unsecured credit ratings. As of December 31, 2013, the annual interest
rates on both bank credit facilities, had they been drawn, would have ranged from 1.0% to 1.2%.
Debt Covenants
The Company’s bank credit facilities contain various covenants including requiring the Company to maintain a
debt to debt-plus-equity ratio of not more than 50%. The Company was in compliance with its debt covenants as
of December 31, 2013.
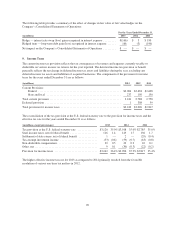
Interest Rate Swap Contracts
The Company uses interest rate swap contracts to convert a portion of its interest rate exposure from fixed rates
to floating rates to more closely align interest expense with interest income received on its cash equivalent and
variable rate investment balances. The floating rates are benchmarked to LIBOR. The swaps are designated as
fair value hedges on the Company’s fixed-rate debt. Since the critical terms of the swaps match those of the debt
being hedged, they are assumed to be highly effective hedges and all changes in fair value of the swaps are
recorded as an adjustment to the carrying value of the related debt with no net impact recorded in the
Consolidated Statements of Operations.
The following table summarizes the location and fair value of the interest rate swap fair value hedges on the
Company’s Consolidated Balance Sheet:
Type of Fair Value Hedge Notional Amount Fair Value Balance Sheet Location
(in billions) (in millions)
December 31, 2013
Interest rate swap contracts ........... $6.2 $163 Other liabilities
December 31, 2012
Interest rate swap contracts ........... $2.8 $ 14 Other assets
11 Other liabilities
89