United Healthcare 2013 Annual Report Download - page 44
Download and view the complete annual report
Please find page 44 of the 2013 United Healthcare annual report below. You can navigate through the pages in the report by either clicking on the pages listed below, or by using the keyword search tool below to find specific information within the annual report.-
 1
1 -
2
-
3
-
4
-
5
-
6
-
7
-
8
-
9
-
10
-
11
-
12
-
13
-
14
-
15
-
16
-
17
-
18
-
19
-
20
-
21
-
22
-
23
-
24
-
25
-
26
-
27
-
28
-
29
-
30
-
31
-
32
-
33
-
 34
34 -
 35
35 -
 36
36 -
 37
37 -
 38
38 -
 39
39 -
 40
40 -
 41
41 -
 42
42 -
 43
43 -
 44
44 -
 45
45 -
 46
46 -
 47
47 -
 48
48 -
 49
49 -
 50
50 -
 51
51 -
 52
52 -
 53
53 -
 54
54 -
55
-
56
-
57
-
58
-
59
-
60
-
61
-
62
-
63
-
64
-
65
-
66
-
67
-
68
-
69
-
70
-
71
-
72
-
73
-
74
-
75
-
76
-
77
-
78
-
79
-
80
-
81
-
82
-
83
-
84
-
85
-
86
-
87
-
88
-
89
-
90
-
91
-
92
-
93
-
94
-
95
-
96
-
97
-
98
-
99
-
100
-
101
-
102
-
103
-
104
-
105
-
106
-
107
-
108
-
109
-
110
-
111
-
112
-
113
-
114
-
115
-
116
-
117
-
118
-
119
-
120
 |
 |

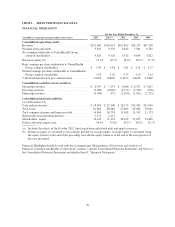
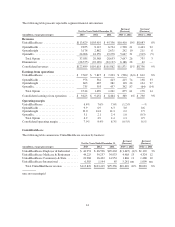
RESULTS SUMMARY
The following table summarizes our consolidated results of operations and other financial information:
(in millions, except percentages and per share data)
For the Years Ended December 31,
Increase/
(Decrease)
Increase/
(Decrease)
2013 2012 2011 2013 vs. 2012 2012 vs. 2011
Revenues:
Premiums ............................. $109,557 $ 99,728 $ 91,983 $ 9,829 10% $7,745 8%
Services .............................. 8,997 7,437 6,613 1,560 21 824 12
Products .............................. 3,190 2,773 2,612 417 15 161 6
Investment and other income .............. 745 680 654 65 10 26 4
Total revenues ........................... 122,489 110,618 101,862 11,871 11 8,756 9
Operating costs:
Medical costs .......................... 89,290 80,226 74,332 9,064 11 5,894 8
Operating costs ......................... 19,362 17,306 15,557 2,056 12 1,749 11
Cost of products sold .................... 2,839 2,523 2,385 316 13 138 6
Depreciation and amortization ............. 1,375 1,309 1,124 66 5 185 16
Total operating costs ...................... 112,866 101,364 93,398 11,502 11 7,966 9
Earnings from operations ................... 9,623 9,254 8,464 369 4 790 9
Interest expense .......................... (708) (632) (505) 76 12 127 25
Earnings before income taxes ............... 8,915 8,622 7,959 293 3 663 8
Provision for income taxes .................. (3,242) (3,096) (2,817) 146 5 279 10
Net earnings ............................. 5,673 5,526 5,142 147 3 384 7
Earnings attributable to noncontrolling
interests .............................. (48) — — 48 — — nm
Net earnings attributable to UnitedHealth Group
common shareholders ................... $ 5,625 $ 5,526 $ 5,142 $ 99 2% $ 384 7%
Diluted earnings per share attributable to
UnitedHealth Group common shareholders . . . $ 5.50 $ 5.28 $ 4.73 $ 0.22 4% $ 0.55 12%
Medical care ratio (a) ...................... 81.5% 80.4% 80.8% 1.1% (0.4)%
Operating cost ratio ....................... 15.8 15.6 15.3 0.2 0.3
Operating margin ......................... 7.9 8.4 8.3 (0.5) 0.1
Tax rate ................................ 36.4 35.9 35.4 0.5 0.5
Net margin .............................. 4.6 5.0 5.0 (0.4) —
Return on equity (b) ....................... 17.7% 18.7% 18.9% (1.0)% (0.2)%
nm = not meaningful
(a) Medical care ratio is calculated as medical costs divided by premium revenue.
(b) Return on equity is calculated as net earnings divided by average equity. Average equity is calculated using
the equity balance at the end of the preceding year and the equity balances at the end of the four quarters in
the year presented.
42