United Healthcare 2013 Annual Report Download - page 86
Download and view the complete annual report
Please find page 86 of the 2013 United Healthcare annual report below. You can navigate through the pages in the report by either clicking on the pages listed below, or by using the keyword search tool below to find specific information within the annual report.-
 1
1 -
2
-
3
-
4
-
5
-
6
-
7
-
8
-
9
-
10
-
11
-
12
-
13
-
14
-
15
-
16
-
17
-
18
-
19
-
20
-
21
-
22
-
23
-
24
-
25
-
26
-
27
-
28
-
29
-
30
-
31
-
32
-
33
-
34
-
35
-
36
-
37
-
38
-
39
-
40
-
41
-
42
-
43
-
44
-
45
-
46
-
47
-
48
-
49
-
50
-
51
-
52
-
53
-
54
-
55
-
56
-
57
-
58
-
59
-
60
-
61
-
62
-
63
-
64
-
65
-
66
-
67
-
68
-
69
-
70
-
71
-
72
-
73
-
74
-
75
-
 76
76 -
 77
77 -
 78
78 -
 79
79 -
 80
80 -
 81
81 -
 82
82 -
 83
83 -
 84
84 -
 85
85 -
 86
86 -
 87
87 -
 88
88 -
 89
89 -
 90
90 -
 91
91 -
 92
92 -
 93
93 -
 94
94 -
 95
95 -
 96
96 -
97
-
98
-
99
-
100
-
101
-
102
-
103
-
104
-
105
-
106
-
107
-
108
-
109
-
110
-
111
-
112
-
113
-
114
-
115
-
116
-
117
-
118
-
119
-
120
 |
 |

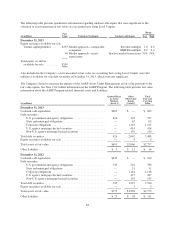
The following table presents quantitative information regarding unobservable inputs that were significant to the
valuation of assets measured at fair value on a recurring basis using Level 3 inputs:
(in millions)
Fair
Value Valuation Technique Unobservable Input
Range
Low High
December 31, 2013
Equity securities-available-for-sale
Venture capital portfolios ...... $233 Market approach - comparable
companies
Revenue multiple
EBITDA multiple
1.0
8.0
6.0
9.0
36 Market approach - recent
transactions
Inactive market transactions N/A N/A
Total equity securities
available-for-sale ........... $269
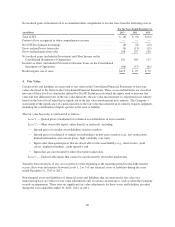
Also included in the Company’s assets measured at fair value on a recurring basis using Level 3 inputs were $42
million of available-for-sale debt securities at December 31, 2013, which were not significant.
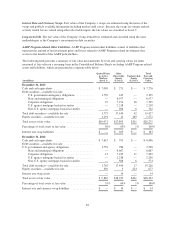
The Company elected to measure the entirety of the AARP Assets Under Management at fair value pursuant to the
fair value option. See Note 2 for further information on the AARP Program. The following table presents fair value
information about the AARP Program-related financial assets and liabilities:
(in millions)
Quoted Prices
in Active
Markets
(Level 1)
Other
Observable
Inputs
(Level 2)
Total
Fair and
Carrying
Value
December 31, 2013
Cash and cash equivalents ..................................... $265 $ — $ 265
Debt securities:
U.S. government and agency obligations ...................... 426 301 727
State and municipal obligations ............................. — 63 63
Corporate obligations ..................................... — 1,145 1,145
U.S. agency mortgage-backed securities ...................... — 414 414
Non-U.S. agency mortgage-backed securities .................. — 139 139
Total debt securities .......................................... 426 2,062 2,488
Equity securities-available-for-sale .............................. — 4 4
Total assets at fair value ....................................... $691 $2,066 $2,757
Other liabilities .............................................. $ 3 $ 11 $ 14
December 31, 2012
Cash and cash equivalents ..................................... $230 $ — $ 230
Debt securities:
U.S. government and agency obligations ...................... 545 244 789
State and municipal obligations ............................. — 51 51
Corporate obligations ..................................... — 1,118 1,118
U.S. agency mortgage-backed securities ...................... — 427 427
Non-U.S. agency mortgage-backed securities .................. — 155 155
Total debt securities .......................................... 545 1,995 2,540
Equity securities-available-for-sale .............................. — 3 3
Total assets at fair value ....................................... $775 $1,998 $2,773
Other liabilities .............................................. $ 23 $ 58 $ 81
84