United Healthcare 2013 Annual Report Download - page 56
Download and view the complete annual report
Please find page 56 of the 2013 United Healthcare annual report below. You can navigate through the pages in the report by either clicking on the pages listed below, or by using the keyword search tool below to find specific information within the annual report.-
 1
1 -
2
-
3
-
4
-
5
-
6
-
7
-
8
-
9
-
10
-
11
-
12
-
13
-
14
-
15
-
16
-
17
-
18
-
19
-
20
-
21
-
22
-
23
-
24
-
25
-
26
-
27
-
28
-
29
-
30
-
31
-
32
-
33
-
34
-
35
-
36
-
37
-
38
-
39
-
40
-
41
-
42
-
43
-
44
-
45
-
 46
46 -
 47
47 -
 48
48 -
 49
49 -
 50
50 -
 51
51 -
 52
52 -
 53
53 -
 54
54 -
 55
55 -
 56
56 -
 57
57 -
 58
58 -
 59
59 -
 60
60 -
 61
61 -
 62
62 -
 63
63 -
 64
64 -
 65
65 -
 66
66 -
67
-
68
-
69
-
70
-
71
-
72
-
73
-
74
-
75
-
76
-
77
-
78
-
79
-
80
-
81
-
82
-
83
-
84
-
85
-
86
-
87
-
88
-
89
-
90
-
91
-
92
-
93
-
94
-
95
-
96
-
97
-
98
-
99
-
100
-
101
-
102
-
103
-
104
-
105
-
106
-
107
-
108
-
109
-
110
-
111
-
112
-
113
-
114
-
115
-
116
-
117
-
118
-
119
-
120
 |
 |

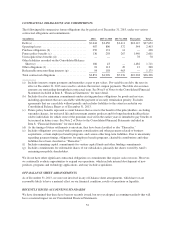
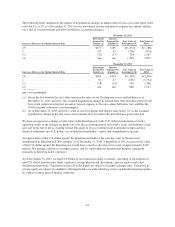
The following table illustrates the sensitivity of these factors and the estimated potential impact on our medical
costs payable estimates for those periods as of December 31, 2013:
Completion Factors
Increase (Decrease) in Factors
Increase (Decrease)
In Medical Costs Payable
(in millions)
(0.75)% ................................................................. $291
(0.50) ................................................................... 194
(0.25) ................................................................... 97
0.25 .................................................................... (96)
0.50 .................................................................... (192)
0.75 .................................................................... (287)
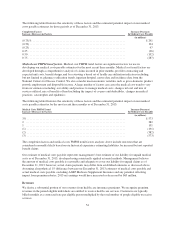
Medical cost PMPM trend factors. Medical cost PMPM trend factors are significant factors we use in
developing our medical costs payable estimates for the most recent three months. Medical cost trend factors are
developed through a comprehensive analysis of claims incurred in prior months, provider contracting and
expected unit costs, benefit design, and by reviewing a broad set of health care utilization indicators including,
but not limited to, pharmacy utilization trends, inpatient hospital census data and incidence data from the
National Centers for Disease Control. We also consider macroeconomic variables such as gross-domestic product
growth, employment and disposable income. A large number of factors can cause the medical cost trend to vary
from our estimates including: our ability and practices to manage medical costs, changes in level and mix of
services utilized, mix of benefits offered including the impact of co-pays and deductibles, changes in medical
practices, catastrophes and epidemics.
The following table illustrates the sensitivity of these factors and the estimated potential impact on our medical
costs payable estimates for the most recent three months as of December 31, 2013:
Medical Costs PMPM Trend
Increase (Decrease) in Factors
Increase (Decrease)
In Medical Costs Payable
(in millions)
3%..................................................................... $573
2 ...................................................................... 382
1 ...................................................................... 191
(1) ..................................................................... (191)
(2) ..................................................................... (382)
(3) ..................................................................... (573)
The completion factors and medical costs PMPM trend factors analyses above include outcomes that are
considered reasonably likely based on our historical experience estimating liabilities for incurred but not reported
benefit claims.
Our estimate of medical costs payable represents management’s best estimate of our liability for unpaid medical
costs as of December 31, 2013, developed using consistently applied actuarial methods. Management believes
the amount of medical costs payable is reasonable and adequate to cover our liability for unpaid claims as of
December 31, 2013; however, actual claim payments may differ from established estimates as discussed above.
Assuming a hypothetical 1% difference between our December 31, 2013 estimates of medical costs payable and
actual medical costs payable, excluding AARP Medicare Supplement Insurance and any potential offsetting
impact from premium rebates, 2013 net earnings would have increased or decreased by $65 million.
Revenues
We derive a substantial portion of our revenues from health care insurance premiums. We recognize premium
revenues in the period eligible individuals are entitled to receive health care services. Customers are typically
billed monthly at a contracted rate per eligible person multiplied by the total number of people eligible to receive
services.
54