United Healthcare 2013 Annual Report Download - page 51
Download and view the complete annual report
Please find page 51 of the 2013 United Healthcare annual report below. You can navigate through the pages in the report by either clicking on the pages listed below, or by using the keyword search tool below to find specific information within the annual report.
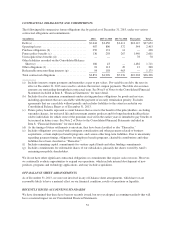
Summary of our Major Sources and Uses of Cash
For the Years Ended December 31, Increase/(Decrease)
(in millions) 2013 2012 2011 2013 vs. 2012 2012 vs. 2011
Sources of cash:
Cash provided by operating activities ......... $6,991 $ 7,155 $ 6,968 $ (164) $ 187
Proceeds from common stock issuances ....... 598 1,078 381 (480) 697
Proceeds from issuances of long-term debt and
commercial paper, net of repayments ....... 152 4,567 346 (4,415) 4,221
Other .................................. 31 — 428 31 (428)
Total sources of cash .......................... 7,772 12,800 8,123
Uses of cash:
Common stock repurchases ................. (3,170) (3,084) (2,994) (86) (90)
Cash paid for acquisitions and noncontrolling
interest shares, net of cash assumed and
dispositions ........................... (1,791) (6,599) (1,459) 4,808 (5,140)
Purchases of investments, net of sales and
maturities ............................. (1,611) (1,299) (1,695) (312) 396
Purchases of property, equipment and
capitalized software, net ................. (1,161) (1,070) (1,018) (91) (52)
Cash dividends paid ...................... (1,056) (820) (651) (236) (169)
Customer funds administered ............... — (324) — 324 (324)
Other .................................. (27) (627) — 600 (627)
Total uses of cash ............................ (8,816) (13,823) (7,817)
Effect of exchange rate changes on cash and cash
equivalents ................................ (86) — — nm nm
Net (decrease) increase in cash .................. $(1,130) $ (1,023) $ 306 $ (107) $(1,329)
nm = not meaningful
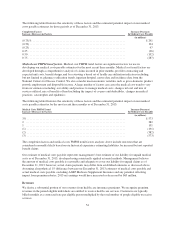
2013 Cash Flows Compared to 2012 Cash Flows
Cash flows provided by operating activities in 2013 decreased due to the net effects of changes in operating
assets and liabilities, including: (a) an increase in pharmacy rebates receivables stemming from the increased
membership at OptumRx, the effects of which were partially offset by (b) increases in medical costs payable due
to the growth in the number of individuals served in our public and senior markets and international businesses.
Other significant items contributing to the overall decrease in cash year-over-year included: (a) decreased
investments in acquisitions and noncontrolling interest shares (the activity in 2013 primarily related to the
acquisition of the remaining publicly traded shares of Amil during the second quarter of 2013 for $1.5 billion);
(b) a decrease in net proceeds from commercial paper and long-term debt, as proceeds from 2013 debt issuances
were fully offset by scheduled maturities and the redemption of all of our outstanding subsidiary debt (in 2012,
the increased cash flows from common stock issuances and proceeds from issuances of commercial paper and
long-term debt primarily related to the Amil acquisition); and (c) increased net purchases of investments.
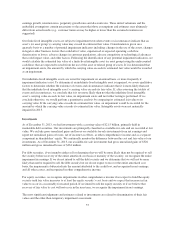
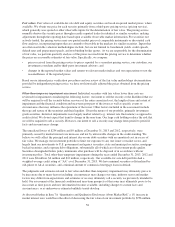
2012 Cash Flows Compared to 2011 Cash Flows
Cash flows from operating activities for 2012 increased due to increased net income and related tax accruals,
which were partially offset by the payment in 2012 of 2011 premium rebate obligations as 2012 was the first year
in which rebate payments were made under Health Reform Legislation.
49


