United Healthcare 2010 Annual Report Download - page 98
Download and view the complete annual report
Please find page 98 of the 2010 United Healthcare annual report below. You can navigate through the pages in the report by either clicking on the pages listed below, or by using the keyword search tool below to find specific information within the annual report.-
 1
1 -
2
-
3
-
4
-
5
-
6
-
7
-
8
-
9
-
10
-
11
-
12
-
13
-
14
-
15
-
16
-
17
-
18
-
19
-
20
-
21
-
22
-
23
-
24
-
25
-
26
-
27
-
28
-
29
-
30
-
31
-
32
-
33
-
34
-
35
-
36
-
37
-
38
-
39
-
40
-
41
-
42
-
43
-
44
-
45
-
46
-
47
-
48
-
49
-
50
-
51
-
52
-
53
-
54
-
55
-
56
-
57
-
58
-
59
-
60
-
61
-
62
-
63
-
64
-
65
-
66
-
67
-
68
-
69
-
70
-
71
-
72
-
73
-
74
-
75
-
76
-
77
-
78
-
79
-
80
-
81
-
82
-
83
-
84
-
85
-
86
-
87
-
 88
88 -
 89
89 -
 90
90 -
 91
91 -
 92
92 -
 93
93 -
 94
94 -
 95
95 -
 96
96 -
 97
97 -
 98
98 -
 99
99 -
 100
100 -
 101
101 -
 102
102 -
 103
103 -
 104
104 -
 105
105 -
 106
106 -
 107
107 -
 108
108 -
109
-
110
-
111
-
112
-
113
-
114
-
115
-
116
-
117
-
118
-
119
-
120
-
121
-
122
-
123
-
124
-
125
-
126
-
127
-
128
-
129
-
130
-
131
-
132
-
133
-
134
-
135
-
136
-
137
-
138
-
139
-
140
-
141
-
142
-
143
-
144
-
145
-
146
-
147
-
148
-
149
-
150
-
151
-
152
-
153
-
154
-
155
-
156
-
157
 |
 |

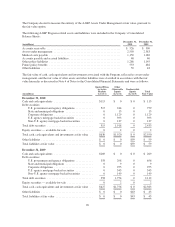
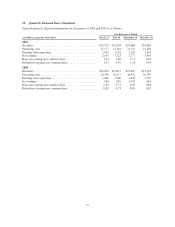
The following table presents reporting segment financial information as of and for the years ended December 31:
(in millions)
Health
Benefits OptumHealth Ingenix
Prescription
Solutions
Corporate and
Intersegment
Eliminations Consolidated
2010
Revenues — external customers:
Premiums ........................... $82,890 $2,515 $ 0 $ 0 $ 0 $85,405
Services ............................ 4,015 337 1,403 64 0 5,819
Products ............................ 0 0 93 2,229 0 2,322
Total revenues — external customers ......... 86,905 2,852 1,496 2,293 0 93,546
Total revenues — intersegment .............. 0 2,930 845 14,478 (18,253) 0
Investment and other income ................ 537 67 0 5 0 609
Total revenues ........................... $87,442 $5,849 $2,341 $16,776 $(18,253) $94,155
Earnings from operations ................... $ 6,636 $ 610 $ 84 $ 534 $ 0 $ 7,864
Interest expense .......................... 0 0 0 0 (481) (481)
Earnings before income taxes ............... $ 6,636 $ 610 $ 84 $ 534 $ (481) $ 7,383
Total assets .............................. $50,178 $4,763 $5,131 $ 3,138 $ (147) $63,063
Purchases of property, equipment and capitalized
software .............................. $ 495 $ 131 $ 155 $ 80 $ 17 $ 878
Depreciation and amortization ............... $ 709 $ 115 $ 158 $ 82 $ 0 $ 1,064
Goodwill impairment ...................... $ 0 $ 0 $ 172 $ 0 $ 0 $ 172
2009
Revenues — external customers:
Premiums ........................... $76,882 $2,433 $ 0 $ 0 $ 0 $79,315
Services ............................ 3,937 277 1,042 50 0 5,306
Products ............................ 0 0 90 1,835 0 1,925
Total revenues — external customers ......... 80,819 2,710 1,132 1,885 0 86,546
Total revenues — intersegment .............. 0 2,753 691 12,562 (16,006) 0
Investment and other income ................ 522 65 0 5 0 592
Total revenues ........................... $81,341 $5,528 $1,823 $14,452 $(16,006) $87,138
Earnings from operations ................... $ 4,788 $ 636 $ 246 $ 689 $ 0 $ 6,359
Interest expense .......................... 0 0 0 0 (551) (551)
Earnings before income taxes ............... $ 4,788 $ 636 $ 246 $ 689 $ (551) $ 5,808
Total assets .............................. $49,068 $4,395 $2,415 $ 3,061 $ 106 $59,045
Purchases of property, equipment and capitalized
software .............................. $ 452 $ 78 $ 142 $ 67 $ 0 $ 739
Depreciation and amortization ............... $ 668 $ 116 $ 129 $ 78 $ 0 $ 991
2008
Revenues — external customers:
Premiums ........................... $71,298 $2,310 $ 0 $ 0 $ 0 $73,608
Services ............................ 3,871 311 925 45 0 5,152
Products ............................ 0 0 95 1,560 0 1,655
Total Revenues — external customers ........ 75,169 2,621 1,020 1,605 0 80,415
Total Revenues — intersegment ............. 0 2,529 532 10,960 (14,021) 0
Investment and other income ................ 688 75 0 8 0 771
Total revenues ........................... $75,857 $5,225 $1,552 $12,573 $(14,021) $81,186
Earnings from operations ................... $ 5,068 $ 718 $ 229 $ 363 $ (1,115) $ 5,263
Interest expense .......................... 0 0 0 0 (639) (639)
Earnings before income taxes ............... $ 5,068 $ 718 $ 229 $ 363 $ (1,754) $ 4,624
Total Assets ............................. $46,459 $4,195 $1,755 $ 2,603 $ 803 $55,815
Purchases of property, equipment and capitalized
software .............................. $ 522 $ 100 $ 112 $ 57 $ 0 $ 791
Depreciation and amortization ............... $ 691 $ 120 $ 105 $ 65 $ 0 $ 981
96