United Healthcare 2010 Annual Report Download - page 73
Download and view the complete annual report
Please find page 73 of the 2010 United Healthcare annual report below. You can navigate through the pages in the report by either clicking on the pages listed below, or by using the keyword search tool below to find specific information within the annual report.-
 1
1 -
2
-
3
-
4
-
5
-
6
-
7
-
8
-
9
-
10
-
11
-
12
-
13
-
14
-
15
-
16
-
17
-
18
-
19
-
20
-
21
-
22
-
23
-
24
-
25
-
26
-
27
-
28
-
29
-
30
-
31
-
32
-
33
-
34
-
35
-
36
-
37
-
38
-
39
-
40
-
41
-
42
-
43
-
44
-
45
-
46
-
47
-
48
-
49
-
50
-
51
-
52
-
53
-
54
-
55
-
56
-
57
-
58
-
59
-
60
-
61
-
62
-
 63
63 -
 64
64 -
 65
65 -
 66
66 -
 67
67 -
 68
68 -
 69
69 -
 70
70 -
 71
71 -
 72
72 -
 73
73 -
 74
74 -
 75
75 -
 76
76 -
 77
77 -
 78
78 -
 79
79 -
 80
80 -
 81
81 -
 82
82 -
 83
83 -
84
-
85
-
86
-
87
-
88
-
89
-
90
-
91
-
92
-
93
-
94
-
95
-
96
-
97
-
98
-
99
-
100
-
101
-
102
-
103
-
104
-
105
-
106
-
107
-
108
-
109
-
110
-
111
-
112
-
113
-
114
-
115
-
116
-
117
-
118
-
119
-
120
-
121
-
122
-
123
-
124
-
125
-
126
-
127
-
128
-
129
-
130
-
131
-
132
-
133
-
134
-
135
-
136
-
137
-
138
-
139
-
140
-
141
-
142
-
143
-
144
-
145
-
146
-
147
-
148
-
149
-
150
-
151
-
152
-
153
-
154
-
155
-
156
-
157
 |
 |

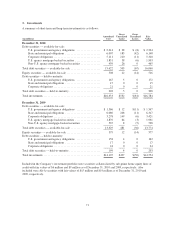
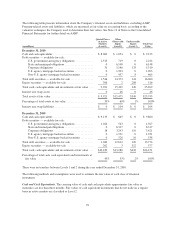
3. Investments
A summary of short-term and long-term investments is as follows:
(in millions)
Amortized
Cost
Gross
Unrealized
Gains
Gross
Unrealized
Losses
Fair
Value
December 31, 2010
Debt securities — available-for-sale:
U.S. government and agency obligations ................. $ 2,214 $ 28 $ (8) $ 2,234
State and municipal obligations ......................... 6,007 183 (42) 6,148
Corporate obligations ................................. 5,111 210 (11) 5,310
U.S. agency mortgage-backed securities .................. 1,851 58 (6) 1,903
Non-U.S. agency mortgage-backed securities .............. 439 26 0 465
Total debt securities — available-for-sale ..................... 15,622 505 (67) 16,060
Equity securities — available-for-sale ........................ 508 22 (14) 516
Debt securities — held-to-maturity:
U.S. government and agency obligations ................. 167 5 0 172
State and municipal obligations ......................... 15 0 0 15
Corporate obligations ................................. 21 0 0 21
Total debt securities — held-to-maturity ...................... 203 5 0 208
Total investments ........................................ $16,333 $532 $(81) $16,784
December 31, 2009
Debt securities — available-for-sale:
U.S. government and agency obligations ................. $ 1,566 $ 12 $(11) $ 1,567
State and municipal obligations ......................... 6,080 248 (11) 6,317
Corporate obligations ................................. 3,278 149 (6) 3,421
U.S. agency mortgage-backed securities .................. 1,870 64 (3) 1,931
Non-U.S. agency mortgage-backed securities .............. 535 8 (5) 538
Total debt securities — available-for-sale ..................... 13,329 481 (36) 13,774
Equity securities — available-for-sale ........................ 579 12 (14) 577
Debt securities — held-to-maturity:
U.S. government and agency obligations ................. 158 4 0 162
State and municipal obligations ......................... 17 0 0 17
Corporate obligations ................................. 24 0 0 24
Total debt securities — held-to-maturity ...................... 199 4 0 203
Total investments ........................................ $14,107 $497 $(50) $14,554
Included in the Company’s investment portfolio were securities collateralized by sub-prime home equity lines of
credit with fair values of $6 million and $9 million as of December 31, 2010 and 2009, respectively. Also
included were Alt-A securities with fair values of $15 million and $19 million as of December 31, 2010 and
2009, respectively.
71