United Healthcare 2010 Annual Report Download - page 45
Download and view the complete annual report
Please find page 45 of the 2010 United Healthcare annual report below. You can navigate through the pages in the report by either clicking on the pages listed below, or by using the keyword search tool below to find specific information within the annual report.-
 1
1 -
2
-
3
-
4
-
5
-
6
-
7
-
8
-
9
-
10
-
11
-
12
-
13
-
14
-
15
-
16
-
17
-
18
-
19
-
20
-
21
-
22
-
23
-
24
-
25
-
26
-
27
-
28
-
29
-
30
-
31
-
32
-
33
-
34
-
 35
35 -
 36
36 -
 37
37 -
 38
38 -
 39
39 -
 40
40 -
 41
41 -
 42
42 -
 43
43 -
 44
44 -
 45
45 -
 46
46 -
 47
47 -
 48
48 -
 49
49 -
 50
50 -
 51
51 -
 52
52 -
 53
53 -
 54
54 -
 55
55 -
56
-
57
-
58
-
59
-
60
-
61
-
62
-
63
-
64
-
65
-
66
-
67
-
68
-
69
-
70
-
71
-
72
-
73
-
74
-
75
-
76
-
77
-
78
-
79
-
80
-
81
-
82
-
83
-
84
-
85
-
86
-
87
-
88
-
89
-
90
-
91
-
92
-
93
-
94
-
95
-
96
-
97
-
98
-
99
-
100
-
101
-
102
-
103
-
104
-
105
-
106
-
107
-
108
-
109
-
110
-
111
-
112
-
113
-
114
-
115
-
116
-
117
-
118
-
119
-
120
-
121
-
122
-
123
-
124
-
125
-
126
-
127
-
128
-
129
-
130
-
131
-
132
-
133
-
134
-
135
-
136
-
137
-
138
-
139
-
140
-
141
-
142
-
143
-
144
-
145
-
146
-
147
-
148
-
149
-
150
-
151
-
152
-
153
-
154
-
155
-
156
-
157
 |
 |

See Note 14 of Notes to the Consolidated Financial Statements for a description of the types and services from
which each of these reporting segments derives its revenues.
Transactions between reporting segments principally consist of sales of pharmacy benefit products and services
to Health Benefits customers by Prescription Solutions, certain product offerings sold to Health Benefits
customers by OptumHealth, and medical benefits cost, quality and utilization data and predictive modeling sold
to Health Benefits by Ingenix. These transactions are recorded at management’s estimate of fair value.
Intersegment transactions are eliminated in consolidation.
The following summarizes the operating results of our reporting segments:
Change Change
(in millions, except percentages) 2010 2009 2008 2010 vs. 2009 2009 vs. 2008
Revenues
Health Benefits ................... $87,442 $ 81,341 $ 75,857 $ 6,101 8 % $ 5,484 7 %
OptumHealth ..................... 5,849 5,528 5,225 321 6 303 6
Ingenix ......................... 2,341 1,823 1,552 518 28 271 17
Prescription Solutions .............. 16,776 14,452 12,573 2,324 16 1,879 15
Eliminations ..................... (18,253) (16,006) (14,021) (2,247) nm (1,985) nm
Consolidated revenues ............. $94,155 $ 87,138 $ 81,186 $ 7,017 8 % $ 5,952 7 %
Earnings from operations
Health Benefits ................... $ 6,636 $ 4,788 $ 5,068 $ 1,848 39 % $ (280) (6)%
OptumHealth ..................... 610 636 718 (26) (4) (82) (11)
Ingenix ......................... 84 246 229 (162) (66) 17 7
Prescription Solutions .............. 534 689 363 (155) (22) 326 90
Corporate ........................ 0 0 (1,115) 0 nm 1,115 nm
Consolidated earnings from
operations ..................... $ 7,864 $ 6,359 $ 5,263 $ 1,505 24 % $ 1,096 21 %
Operating margin
Health Benefits ................... 7.6% 5.9% 6.7% 1.7% (0.8)%
OptumHealth ..................... 10.4 11.5 13.7 (1.1) (2.2)
Ingenix ......................... 3.6 13.5 14.8 (9.9) (1.3)
Prescription Solutions .............. 3.2 4.8 2.9 (1.6) 1.9
Consolidated operating margin ....... 8.4% 7.3% 6.5% 1.1% 0.8%
nm = not meaningful
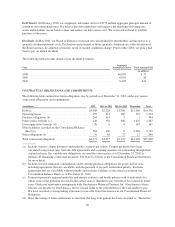
The following summarizes the number of individuals served by our Health Benefits businesses, by major market
segment and funding arrangement, at December 31:
Change Change
(in thousands, except percentages) 2010 2009 2008 2010 vs. 2009 2009 vs. 2008
Commercial risk-based ......................... 9,405 9,415 10,360 (10) (0)% (945) (9)%
Commercial fee-based .......................... 15,405 15,210 15,985 195 1 (775) (5)
Total commercial .............................. 24,810 24,625 26,345 185 1 (1,720) (7)
Medicare Advantage ........................... 2,070 1,790 1,495 280 16 295 20
Medicaid .................................... 3,320 2,900 2,515 420 14 385 15
Standardized Medicare supplement ............... 2,770 2,680 2,540 90 3 140 6
Total public and senior ......................... 8,160 7,370 6,550 790 11 820 13
Total Health Benefits – medical .................. 32,970 31,995 32,895 975 3 (900) (3)
Medicare Part D stand-alone ..................... 4,530 4,300 4,060 230 5 240 6
Total Health Benefits .......................... 37,500 36,295 36,955 1,205 3 % (660) (2)%
43