United Healthcare 2010 Annual Report Download - page 75
Download and view the complete annual report
Please find page 75 of the 2010 United Healthcare annual report below. You can navigate through the pages in the report by either clicking on the pages listed below, or by using the keyword search tool below to find specific information within the annual report.-
 1
1 -
2
-
3
-
4
-
5
-
6
-
7
-
8
-
9
-
10
-
11
-
12
-
13
-
14
-
15
-
16
-
17
-
18
-
19
-
20
-
21
-
22
-
23
-
24
-
25
-
26
-
27
-
28
-
29
-
30
-
31
-
32
-
33
-
34
-
35
-
36
-
37
-
38
-
39
-
40
-
41
-
42
-
43
-
44
-
45
-
46
-
47
-
48
-
49
-
50
-
51
-
52
-
53
-
54
-
55
-
56
-
57
-
58
-
59
-
60
-
61
-
62
-
63
-
64
-
 65
65 -
 66
66 -
 67
67 -
 68
68 -
 69
69 -
 70
70 -
 71
71 -
 72
72 -
 73
73 -
 74
74 -
 75
75 -
 76
76 -
 77
77 -
 78
78 -
 79
79 -
 80
80 -
 81
81 -
 82
82 -
 83
83 -
 84
84 -
 85
85 -
86
-
87
-
88
-
89
-
90
-
91
-
92
-
93
-
94
-
95
-
96
-
97
-
98
-
99
-
100
-
101
-
102
-
103
-
104
-
105
-
106
-
107
-
108
-
109
-
110
-
111
-
112
-
113
-
114
-
115
-
116
-
117
-
118
-
119
-
120
-
121
-
122
-
123
-
124
-
125
-
126
-
127
-
128
-
129
-
130
-
131
-
132
-
133
-
134
-
135
-
136
-
137
-
138
-
139
-
140
-
141
-
142
-
143
-
144
-
145
-
146
-
147
-
148
-
149
-
150
-
151
-
152
-
153
-
154
-
155
-
156
-
157
 |
 |

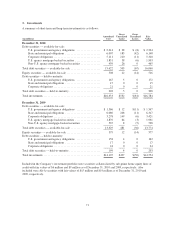
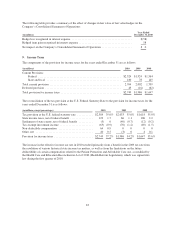
The fair value of available-for-sale investments with gross unrealized losses by investment type and length of
time that individual securities have been in a continuous unrealized loss position were as follows:
Less Than 12 Months 12 Months or Greater Total
(in millions)
Fair
Value
Gross
Unrealized
Losses
Fair
Value
Gross
Unrealized
Losses
Fair
Value
Gross
Unrealized
Losses
December 31, 2010
Debt securities — available-for-sale:
U.S. government and agency obligations . . . $ 548 $ (8) $ 0 $ 0 $ 548 $ (8)
State and municipal obligations .......... 1,383 (40) 18 (2) 1,401 (42)
Corporate obligations .................. 949 (11) 14 0 963 (11)
U.S. agency mortgage-backed securities .... 355 (6) 0 0 355 (6)
Total debt securities — available-for-sale ....... $3,235 $(65) $ 32 $ (2) $3,267 $(67)
Equity securities — available-for-sale ......... $ 206 $(14) $ 11 $ 0 $ 217 $(14)
December 31, 2009
Debt securities — available-for-sale:
U.S. government and agency obligations . . . $ 437 $(11) $ 4 $ 0 $ 441 $(11)
State and municipal obligations .......... 392 (6) 100 (5) 492 (11)
Corporate obligations .................. 304 (3) 69 (3) 373 (6)
U.S. agency mortgage-backed securities .... 355 (3) 2 0 357 (3)
Non-U.S. agency mortgage-backed
securities .......................... 134 (1) 86 (4) 220 (5)
Total debt securities — available-for-sale ....... $1,622 $(24) $261 $(12) $1,883 $(36)
Equity securities — available-for-sale ......... $ 169 $(13) $ 1 $ (1) $ 170 $(14)
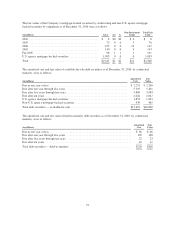
The Company’s mortgage-backed securities in an unrealized loss position by credit rating distribution were as
follows:
December 31, 2010 December 31, 2009
(in millions) Fair Value
Gross
Unrealized
Losses Fair Value
Gross
Unrealized
Losses
AAA ................................................. $355 $(6) $543 $(6)
AA .................................................. 0 0 31 (2)
A.................................................... 0 0 0 0
BBB ................................................. 0 0 1 0
Non-investment grade ................................... 0 0 2 0
Total ................................................. $355 $(6) $577 $(8)
The unrealized losses from all securities as of December 31, 2010 were generated from approximately 2,600
positions out of a total of approximately 14,000 positions. The Company believes that it will collect the principal
and interest due on its investments that have an amortized cost in excess of fair value. The unrealized losses on
investments in state and municipal obligations and corporate obligations as of December 31, 2010 were primarily
caused by interest rate increases and not by unfavorable changes in the credit ratings associated with these
securities. The Company evaluates impairment at each reporting period for securities where the fair value of the
investment is less than its amortized cost. The Company evaluated the underlying credit quality of the issuers and
the credit ratings of the state and municipal obligations and the corporate obligations, noting neither a significant
deterioration since purchase nor other factors leading to an other-than-temporary impairment (OTTI). The
unrealized losses on mortgage-backed securities as of December 31, 2010 were primarily caused by higher
73