United Healthcare 2010 Annual Report Download - page 76
Download and view the complete annual report
Please find page 76 of the 2010 United Healthcare annual report below. You can navigate through the pages in the report by either clicking on the pages listed below, or by using the keyword search tool below to find specific information within the annual report.-
 1
1 -
2
-
3
-
4
-
5
-
6
-
7
-
8
-
9
-
10
-
11
-
12
-
13
-
14
-
15
-
16
-
17
-
18
-
19
-
20
-
21
-
22
-
23
-
24
-
25
-
26
-
27
-
28
-
29
-
30
-
31
-
32
-
33
-
34
-
35
-
36
-
37
-
38
-
39
-
40
-
41
-
42
-
43
-
44
-
45
-
46
-
47
-
48
-
49
-
50
-
51
-
52
-
53
-
54
-
55
-
56
-
57
-
58
-
59
-
60
-
61
-
62
-
63
-
64
-
65
-
 66
66 -
 67
67 -
 68
68 -
 69
69 -
 70
70 -
 71
71 -
 72
72 -
 73
73 -
 74
74 -
 75
75 -
 76
76 -
 77
77 -
 78
78 -
 79
79 -
 80
80 -
 81
81 -
 82
82 -
 83
83 -
 84
84 -
 85
85 -
 86
86 -
87
-
88
-
89
-
90
-
91
-
92
-
93
-
94
-
95
-
96
-
97
-
98
-
99
-
100
-
101
-
102
-
103
-
104
-
105
-
106
-
107
-
108
-
109
-
110
-
111
-
112
-
113
-
114
-
115
-
116
-
117
-
118
-
119
-
120
-
121
-
122
-
123
-
124
-
125
-
126
-
127
-
128
-
129
-
130
-
131
-
132
-
133
-
134
-
135
-
136
-
137
-
138
-
139
-
140
-
141
-
142
-
143
-
144
-
145
-
146
-
147
-
148
-
149
-
150
-
151
-
152
-
153
-
154
-
155
-
156
-
157
 |
 |

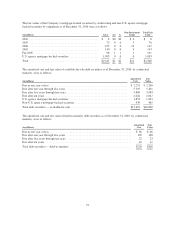
interest rates in the marketplace, reflecting the higher perceived risk assigned by fixed-income investors to
commercial mortgage-backed securities. These unrealized losses represented less than 1% of the total amortized
cost of the Company’s mortgage-backed security holdings as of December 31, 2010. The Company believes
these losses to be temporary. All of the Company’s mortgage-backed securities in an unrealized loss position as
of December 31, 2010 were rated “AAA” with no known deterioration or other factors leading to an OTTI. As of
December 31, 2010, the Company did not have the intent to sell any of the securities in an unrealized loss
position.
As of December 31, 2010, the Company’s holdings of non-U.S. agency mortgage-backed securities included $8
million of commercial mortgage loans in default. These investments were acquired in the first quarter of 2008
pursuant to an acquisition and were recorded at fair value. They represented less than 1% of the Company’s total
mortgage-backed security holdings as of December 31, 2010.
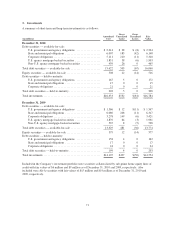
A portion of the Company’s investments in equity securities and venture capital funds consists of investments
held in various public and nonpublic companies concentrated in the areas of health care services and related
information technologies. Market conditions that affect the value of health care and related technology stocks
will likewise impact the value of the Company’s equity portfolio. The equity securities and venture capital funds
were evaluated for severity and duration of unrealized loss, overall market volatility and other market factors.
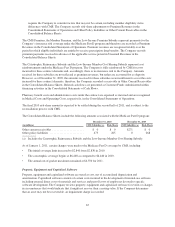
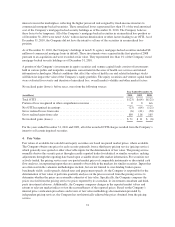
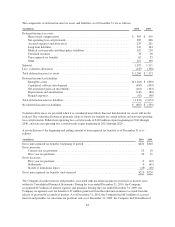
Net realized gains (losses), before taxes, were from the following sources:
Year Ended December 31,
(in millions) 2010 2009 2008
Total OTTI ............................................................. $(23) $ (64) $(121)
Portion of loss recognized in other comprehensive income ........................ 0 0 n/a
Net OTTI recognized in earnings ............................................ (23) (64) (121)
Gross realized losses from sales ............................................. (6) (41) (50)
Gross realized gains from sales ............................................. 100 116 165
Net realized gains (losses) ................................................. $ 71 $ 11 $ (6)
For the years ended December 31, 2010 and 2009, all of the recorded OTTI charges resulted from the Company’s
intent to sell certain impaired securities.
4. Fair Value
Fair values of available-for-sale debt and equity securities are based on quoted market prices, where available.
The Company obtains one price for each security primarily from a third-party pricing service (pricing service),
which generally uses quoted or other observable inputs for the determination of fair value. The pricing service
normally derives the security prices through recently reported trades for identical or similar securities, making
adjustments through the reporting date based upon available observable market information. For securities not
actively traded, the pricing service may use quoted market prices of comparable instruments or discounted cash
flow analyses, incorporating inputs that are currently observable in the markets for similar securities. Inputs that
are often used in the valuation methodologies include, but are not limited to, non-binding broker quotes,
benchmark yields, credit spreads, default rates and prepayment speeds. As the Company is responsible for the
determination of fair value, it performs quarterly analyses on the prices received from the pricing service to
determine whether the prices are reasonable estimates of fair value. Specifically, the Company compares the
prices received from the pricing service to prices reported by its custodian, its investment consultant and third-
party investment advisors. Additionally, the Company compares changes in the reported market values and
returns to relevant market indices to test the reasonableness of the reported prices. Based on the Company’s
internal price verification procedures and review of fair value methodology documentation provided by
independent pricing services, the Company has not historically adjusted the prices obtained from the pricing
service.
74