United Healthcare 2010 Annual Report Download - page 79
Download and view the complete annual report
Please find page 79 of the 2010 United Healthcare annual report below. You can navigate through the pages in the report by either clicking on the pages listed below, or by using the keyword search tool below to find specific information within the annual report.-
 1
1 -
2
-
3
-
4
-
5
-
6
-
7
-
8
-
9
-
10
-
11
-
12
-
13
-
14
-
15
-
16
-
17
-
18
-
19
-
20
-
21
-
22
-
23
-
24
-
25
-
26
-
27
-
28
-
29
-
30
-
31
-
32
-
33
-
34
-
35
-
36
-
37
-
38
-
39
-
40
-
41
-
42
-
43
-
44
-
45
-
46
-
47
-
48
-
49
-
50
-
51
-
52
-
53
-
54
-
55
-
56
-
57
-
58
-
59
-
60
-
61
-
62
-
63
-
64
-
65
-
66
-
67
-
68
-
 69
69 -
 70
70 -
 71
71 -
 72
72 -
 73
73 -
 74
74 -
 75
75 -
 76
76 -
 77
77 -
 78
78 -
 79
79 -
 80
80 -
 81
81 -
 82
82 -
 83
83 -
 84
84 -
 85
85 -
 86
86 -
 87
87 -
 88
88 -
 89
89 -
90
-
91
-
92
-
93
-
94
-
95
-
96
-
97
-
98
-
99
-
100
-
101
-
102
-
103
-
104
-
105
-
106
-
107
-
108
-
109
-
110
-
111
-
112
-
113
-
114
-
115
-
116
-
117
-
118
-
119
-
120
-
121
-
122
-
123
-
124
-
125
-
126
-
127
-
128
-
129
-
130
-
131
-
132
-
133
-
134
-
135
-
136
-
137
-
138
-
139
-
140
-
141
-
142
-
143
-
144
-
145
-
146
-
147
-
148
-
149
-
150
-
151
-
152
-
153
-
154
-
155
-
156
-
157
 |
 |

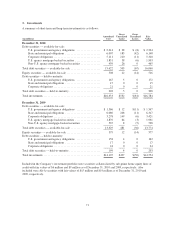
Debt Securities. The estimated fair values of debt securities held as available-for-sale are based on quoted market
prices and/or other market data for the same or comparable instruments and transactions in establishing the
prices. Fair values of debt securities that do not trade on a regular basis in active markets are classified as
Level 2.
Equity Securities. Equity securities are held as available-for-sale investments. Fair value estimates for Level 1
and Level 2 publicly traded equity securities are based on quoted market prices and/or other market data for the
same or comparable instruments and transactions in establishing the prices. The fair values of Level 3
investments in venture capital portfolios are estimated using market modeling approaches that rely heavily on
management assumptions and qualitative observations. These investments totaled $166 million and $282 million
as of December 31, 2010 and 2009, respectively. The fair values of the Company’s various venture capital
investments are computed using limited quantitative and qualitative observations of activity for similar
companies in the current market. The key inputs utilized in the Company’s market modeling include, as
applicable, transactions for comparable companies in similar industries and having similar revenue and growth
characteristics; similar preferences in the capital structure; discounted cash flows; liquidation values and
milestones established at initial funding; and the assumption that the values of the Company’s venture capital
investments can be inferred from these inputs. The Company’s remaining Level 3 equity securities holdings of
$42 million and $30 million as of December 31, 2010 and 2009, respectively, consist of preferred stock and other
items for which there are no active markets.
Interest Rate Swaps. Fair values of the Company’s interest rate swaps are estimated using the terms of the swaps
and publicly available market yield curves. Because the swaps are unique and not actively traded, the fair values
are classified as Level 2.
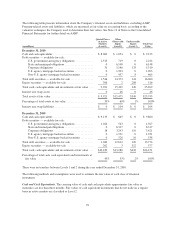
A reconciliation of the beginning and ending balances of assets measured at fair value on a recurring basis using
Level 3 inputs is as follows:
December 31, 2010 December 31, 2009 December 31, 2008
(in millions)
Debt
Securities
Equity
Securities Total
Debt
Securities
Equity
Securities Total
Debt
Securities
Equity
Securities Total
Balance at beginning of period .... $120 $ 312 $ 432 $ 62 $304 $366 $ 0 $133 $133
Purchases (sales), net ............ 19 (122) (103) 64 22 86 14 202 216
Net unrealized gains in accumulated
other comprehensive income .... 0 9 9 0 7 7 0 2 2
Net realized gains (losses) in
investment and other income .... 2 9 11 (6) (21) (27) 0 (54) (54)
Transfers into Level 3 ........... 0 0 0 0 0 0 48 21 69
Balance at end of period .......... $141 $ 208 $ 349 $120 $312 $432 $62 $304 $366
With the exception of the goodwill impairment related to the Ingenix business, as discussed in Note 6 of Notes to
the Consolidated Financial Statements, there were no significant fair value adjustments recorded during the years
ended December 31, 2010 and 2009 for non-financial assets and liabilities or financial assets and liabilities that
are measured at fair value on a nonrecurring basis. These assets and liabilities are subject to fair value
adjustments only in certain circumstances, such as when the Company records an impairment and are classified
as Level 3.
77