United Healthcare 2006 Annual Report Download - page 99
Download and view the complete annual report
Please find page 99 of the 2006 United Healthcare annual report below. You can navigate through the pages in the report by either clicking on the pages listed below, or by using the keyword search tool below to find specific information within the annual report.-
 1
1 -
2
-
3
-
4
-
5
-
6
-
7
-
8
-
9
-
10
-
11
-
12
-
13
-
14
-
15
-
16
-
17
-
18
-
19
-
20
-
21
-
22
-
23
-
24
-
25
-
26
-
27
-
28
-
29
-
30
-
31
-
32
-
33
-
34
-
35
-
36
-
37
-
38
-
39
-
40
-
41
-
42
-
43
-
44
-
45
-
46
-
47
-
48
-
49
-
50
-
51
-
52
-
53
-
54
-
55
-
56
-
57
-
58
-
59
-
60
-
61
-
62
-
63
-
64
-
65
-
66
-
67
-
68
-
69
-
70
-
71
-
72
-
73
-
74
-
75
-
76
-
77
-
78
-
79
-
80
-
81
-
82
-
83
-
84
-
85
-
86
-
87
-
88
-
 89
89 -
 90
90 -
 91
91 -
 92
92 -
 93
93 -
 94
94 -
 95
95 -
 96
96 -
 97
97 -
 98
98 -
 99
99 -
 100
100 -
 101
101 -
 102
102 -
 103
103 -
 104
104 -
 105
105 -
 106
106 -
 107
107 -
 108
108 -
 109
109 -
110
-
111
-
112
-
113
-
114
-
115
-
116
-
117
-
118
-
119
-
120
-
121
-
122
-
123
-
124
-
125
-
126
-
127
-
128
-
129
-
130
 |
 |

The risk-free interest rate is based on U.S. Treasury yields in effect at the time of grant. Expected volatilities are
based on a blend of the implied volatilities from traded options on our common stock and the historical volatility
of our common stock. We use historical data to estimate option and SAR exercises and employee terminations
within the valuation model. The expected term of options and SARs granted represents the period of time that the
awards granted are expected to be outstanding based on historical exercise patterns.
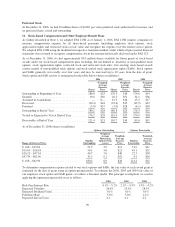
The weighted-average fair value of stock options and SARs granted was $11 per share, $14 per share and $12 per
share for 2006, 2005 and 2004, respectively. The aggregate fair value of stock options and SARs that vested
during 2006, 2005 and 2004 was $371 million, $350 million and $322 million, respectively. As of December 31,
2006, the aggregate intrinsic value of outstanding stock options and SARs was $4.6 billion, with a weighted-
average remaining contractual term of 6.0 years. The aggregate intrinsic value of exercisable stock options and
SARs at that same date was $4.0 billion, with a weighted-average remaining contractual term of 4.8 years. The
total intrinsic value of options and SARs exercised during 2006, 2005 and 2004 was $753 million, $847 million
and $951 million, respectively.
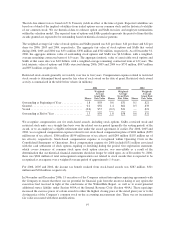
Restricted stock awards generally vest ratably over two to four years. Compensation expense related to restricted
stock awards is determined based upon the fair value of each award on the date of grant. Restricted stock award
activity is summarized in the table below (shares in millions):
2006 2005 2004
Shares
Weighted-
Average
Grant Date
Fair Value Shares
Weighted-
Average
Grant Date
Fair Value Shares
Weighted-
Average
Grant Date
Fair Value
Outstanding at Beginning of Year .............. 1.8 $58 0.6 $31 0.1 $21
Granted ................................... 0.1 $56 1.4 $62 0.5 $33
Vested .................................... (0.6) $57 (0.2) $31 — $21
Outstanding at End of Year ................... 1.3 $59 1.8 $58 0.6 $31
We recognize compensation cost for stock-based awards, including stock options, SARs, restricted stock and
restricted stock units, on a straight-line basis over the related service period (generally the vesting period) of the
award, or to an employee’s eligible retirement date under the award agreement, if earlier. For 2006, 2005 and
2004, we recognized compensation expense related to our stock-based compensation plans of $404 million ($259
million net of tax effects), $306 million ($194 million net of tax effects) and $244 million ($155 million net of
tax effects), respectively. Stock-based compensation expense is recognized within Operating Costs in the
Consolidated Statements of Operations. Stock compensation expense for 2006 included $31 million associated
with the cash settlement of stock options expiring or forfeiting during the period. Our registration statement,
which covers issuances of common stock upon stock option exercise, was unavailable as a result of the
determination that our historical financial statements should no longer be relied upon. As of December 31, 2006,
there was $634 million of total unrecognized compensation cost related to stock awards that is expected to be
recognized as an expense over a weighted-average period of approximately 1.4 years.
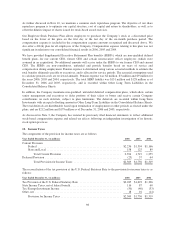
For 2006, 2005 and 2004, the income tax benefit realized from stock-based awards was $287 million, $311
million and $304 million, respectively.
In November and December 2006, 15 executives of the Company entered into options repricing agreements with
the Company to ensure that there was no potential for financial gain from the incorrect dating of any option the
executives had received in light of the conclusions of the WilmerHale Report, as well as to avoid potential
additional surtax liability under Section 409A of the Internal Revenue Code (Section 409A). These repricings
increased the exercise prices of certain awards to either the highest closing price of the stated grant year or to the
closing price of the Company’s common stock on the accounting measurement date. There was no incremental
fair value associated with these modifications.
97