United Healthcare 2006 Annual Report Download - page 36
Download and view the complete annual report
Please find page 36 of the 2006 United Healthcare annual report below. You can navigate through the pages in the report by either clicking on the pages listed below, or by using the keyword search tool below to find specific information within the annual report.-
 1
1 -
2
-
3
-
4
-
5
-
6
-
7
-
8
-
9
-
10
-
11
-
12
-
13
-
14
-
15
-
16
-
17
-
18
-
19
-
20
-
21
-
22
-
23
-
24
-
25
-
 26
26 -
 27
27 -
 28
28 -
 29
29 -
 30
30 -
 31
31 -
 32
32 -
 33
33 -
 34
34 -
 35
35 -
 36
36 -
 37
37 -
 38
38 -
 39
39 -
 40
40 -
 41
41 -
 42
42 -
 43
43 -
 44
44 -
 45
45 -
 46
46 -
47
-
48
-
49
-
50
-
51
-
52
-
53
-
54
-
55
-
56
-
57
-
58
-
59
-
60
-
61
-
62
-
63
-
64
-
65
-
66
-
67
-
68
-
69
-
70
-
71
-
72
-
73
-
74
-
75
-
76
-
77
-
78
-
79
-
80
-
81
-
82
-
83
-
84
-
85
-
86
-
87
-
88
-
89
-
90
-
91
-
92
-
93
-
94
-
95
-
96
-
97
-
98
-
99
-
100
-
101
-
102
-
103
-
104
-
105
-
106
-
107
-
108
-
109
-
110
-
111
-
112
-
113
-
114
-
115
-
116
-
117
-
118
-
119
-
120
-
121
-
122
-
123
-
124
-
125
-
126
-
127
-
128
-
129
-
130
 |
 |

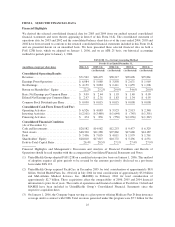
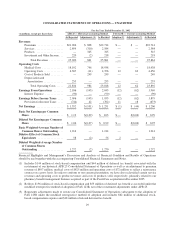
Operating costs in 2006 totaled $10.0 billion, an increase of $2.8 billion, or 40%, over 2005. Excluding the
impact of acquisitions, operating costs increased by approximately 13% over 2005. This increase was primarily
due to the new Medicare Part D program as well as a 4% increase in the total number of individuals served by
Health Care Services and Uniprise during 2006 (excluding the impact of acquisitions), growth in Specialized
Care Services and Ingenix, general operating cost inflation, and the specific items discussed above, partially
offset by productivity gains from technology deployment, cost savings associated with acquisition integrations
and other cost management initiatives.
Cost of Products Sold
Cost of products sold in 2006 totaled $599 million, an increase of $510 million over 2005. This increase was
primarily due to pharmacy sales at our PBM business, which was acquired in December 2005 with the purchase
of PacifiCare.
Depreciation and Amortization
Depreciation and amortization in 2006 was $670 million, an increase of $217 million, or 48%, over 2005.
Approximately $85 million of this increase was related to intangible assets from PacifiCare and other businesses
acquired since the beginning of 2005. The remaining increase was primarily due to additional depreciation and
amortization from higher levels of computer equipment and capitalized software as a result of technology
enhancements, business growth and businesses acquired since the beginning of 2005.
Income Taxes
Our effective income tax rate was 36.3% in 2006 and in 2005.
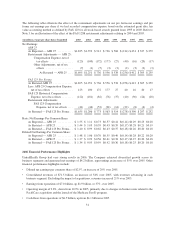
Business Segments
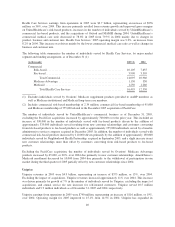
The following summarizes the operating results of our business segments for the years ended December 31 (in
millions):
Revenues 2006 2005
Percent
Change
(As Restated) (As Restated)
Health Care Services ........................................... $64,180 $40,023 60%
Uniprise ..................................................... 5,451 4,893 11%
Specialized Care Services ....................................... 3,989 2,806 42%
Ingenix ...................................................... 976 807 21%
Intersegment Eliminations ....................................... (3,054) (2,104) nm
Consolidated Revenues ..................................... $71,542 $46,425 54%
Earnings From Operations 2006 2005
Percent
Change
(As Restated) (As Restated)
Health Care Services ........................................... $ 5,128 $ 3,664 40%
Uniprise ..................................................... 897 740 21%
Specialized Care Services ....................................... 769 541 42%
Ingenix ...................................................... 190 135 41%
Consolidated Earnings From Operations ........................ $ 6,984 $ 5,080 37%
nm - not meaningful
34