United Healthcare 2006 Annual Report Download - page 42
Download and view the complete annual report
Please find page 42 of the 2006 United Healthcare annual report below. You can navigate through the pages in the report by either clicking on the pages listed below, or by using the keyword search tool below to find specific information within the annual report.-
 1
1 -
2
-
3
-
4
-
5
-
6
-
7
-
8
-
9
-
10
-
11
-
12
-
13
-
14
-
15
-
16
-
17
-
18
-
19
-
20
-
21
-
22
-
23
-
24
-
25
-
26
-
27
-
28
-
29
-
30
-
31
-
 32
32 -
 33
33 -
 34
34 -
 35
35 -
 36
36 -
 37
37 -
 38
38 -
 39
39 -
 40
40 -
 41
41 -
 42
42 -
 43
43 -
 44
44 -
 45
45 -
 46
46 -
 47
47 -
 48
48 -
 49
49 -
 50
50 -
 51
51 -
 52
52 -
53
-
54
-
55
-
56
-
57
-
58
-
59
-
60
-
61
-
62
-
63
-
64
-
65
-
66
-
67
-
68
-
69
-
70
-
71
-
72
-
73
-
74
-
75
-
76
-
77
-
78
-
79
-
80
-
81
-
82
-
83
-
84
-
85
-
86
-
87
-
88
-
89
-
90
-
91
-
92
-
93
-
94
-
95
-
96
-
97
-
98
-
99
-
100
-
101
-
102
-
103
-
104
-
105
-
106
-
107
-
108
-
109
-
110
-
111
-
112
-
113
-
114
-
115
-
116
-
117
-
118
-
119
-
120
-
121
-
122
-
123
-
124
-
125
-
126
-
127
-
128
-
129
-
130
 |
 |

Health Care Services earnings from operations in 2005 were $3.7 billion, representing an increase of $976
million, or 36%, over 2004. This increase primarily resulted from revenue growth and improved gross margins
on UnitedHealthcare’s risk-based products, increases in the number of individuals served by UnitedHealthcare’s
commercial fee-based products, and the acquisitions of Oxford and MAMSI during 2004. UnitedHealthcare’s
commercial medical care ratio decreased to 78.6% in 2005 from 79.3% in 2004 mainly due to changes in
product, business and customer mix. Health Care Services’ 2005 operating margin was 9.2%, an increase from
8.2% in 2004. This increase was driven mainly by the lower commercial medical care ratio as well as changes in
business and customer mix.
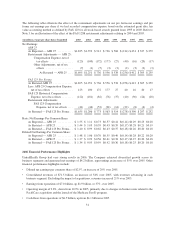
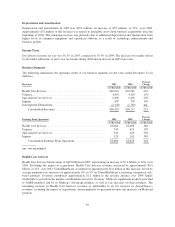
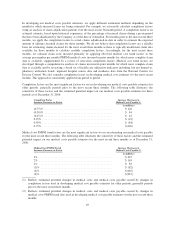
The following table summarizes the number of individuals served by Health Care Services, by major market
segment and funding arrangement, as of December 31 (1):
(in thousands) 2005 (2) 2004
Commercial
Risk-based ..................................................... 10,105 7,655
Fee-based ...................................................... 3,990 3,305
Total Commercial ........................................... 14,095 10,960
Medicare Advantage ............................................. 1,150 330
Medicaid ...................................................... 1,250 1,260
Total Health Care Services .................................... 16,495 12,550
(1) Excludes individuals served by Ovations’ Medicare supplement products provided to AARP members as
well as Medicare institutional and Medicaid long-term care members.
(2) Includes commercial risk-based membership of 2.34 million, commercial fee-based membership of 95,000
and Medicare membership of 755,000 related to the December 2005 acquisition of PacifiCare.
The number of individuals served by UnitedHealthcare’s commercial business as of December 31, 2005,
excluding the PacifiCare acquisition, increased by approximately 700,000 over the prior year. This included an
increase of 590,000 in the number of individuals served with fee-based products driven by the addition of
approximately 335,000 individuals served resulting from new customer relationships and customers converting
from risk-based products to fee-based products as well as approximately 255,000 individuals served by a benefits
administrative services company acquired in December 2005. In addition, the number of individuals served with
commercial risk-based products increased by 110,000 driven primarily by the addition of approximately 130,000
individuals served by Neighborhood Health Partnership, acquired in September 2005, and a slight increase in net
new customer relationships more than offset by customers converting from risk-based products to fee-based
products.
Excluding the PacifiCare acquisition, the number of individuals served by Ovations’ Medicare Advantage
products increased by 65,000, or 20%, over 2004 due primarily to new customer relationships. AmeriChoice’s
Medicaid enrollment decreased by 10,000 from 2004 due primarily to the withdrawal of participation in one
market during the third quarter of 2005 partially offset by new customer relationships since 2004.
Uniprise
Uniprise revenues in 2005 were $4.9 billion, representing an increase of $575 million, or 13%, over 2004.
Excluding the impact of acquisitions, Uniprise revenues increased approximately 11% over 2004. This increase
was driven primarily by growth of 7% in the number of individuals served by Uniprise, excluding the impact of
acquisitions, and annual service fee rate increases for self-insured customers. Uniprise served 10.5 million
individuals and 9.9 million individuals as of December 31, 2005 and 2004, respectively.
Uniprise earnings from operations in 2005 were $740 million, representing an increase of $116 million, or 19%,
over 2004. Operating margin for 2005 improved to 15.1% from 14.5% in 2004. Uniprise has expanded its
40